(Source : Cartoonresource/Shutterstock)
A lot is written on volatility. Until volatility began climbing, the most common complaint in the financial community was that volatility was too low. So why all the hand-wringing over volatility?
The Volatility Index – India VIX
The Volatility Index is a measure of market’s expectation of volatility. It is a measure of the amount by which an underlying index (Nifty) is expected to fluctuate, in the near term. India VIX is the volatility index based on the Nifty index – option prices. The VIX futures are traded in the Futures & Options segment.
Does the VIX help in predicting volatility?
The graph of the Volatility index (VIX) from inception, and the comparison with Nifty is shown in the image below:
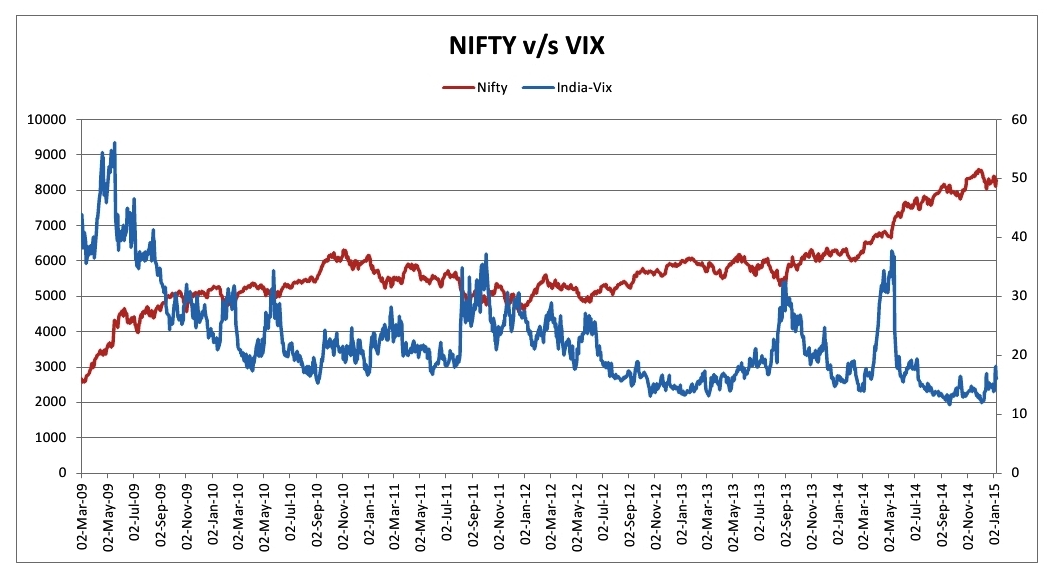
(Click to Enlarge)
-
Looking at the image it is clear that the Nifty and the VIX are inversely correlated. The Nifty climbs when the VIX falls, and vice versa.
-
A simple reading of the graph seems to suggest that there is no volatility when there is a secular up trend (as in 2014). Also, it seems to suggest that there is no volatility in a secular down trend, as was the case in 2013 (from May till September). If the volatility index (VIX) were to be a true measure of volatility, then the graph seems to suggest that there is no volatility in a secular bull or bear trend. We all know that this is not true. Markets keep having bouts of volatility at all times.
-
Volatility and risk are often confused. Volatility is the market going up and down, sometimes by a lot. Risk is our own tendency to react to these moves by buying high and selling low. Volatility generally is accompanied by fear. Hence, the VIX is commonly called the ‘fear gauge’. The natural tendency is to be afraid. The longer volatility continues, the more intense and acute is the fear.
-
Volatility doesn’t predict volatility, any more, than past returns predict future performance. The VIX has lost its relevance in so far as predicting the future direction of the Nifty. The graphic above looks easy to understand. That is because it is on historical date. It tells you what has happened, not what will happen.
-
It’s not volatility itself that generally leads to poor longer-term performance. It is our emotional reaction to volatility, that ultimately leads to poor performance. Most of us have historically run away from chaotic and turbulent markets.
-
Volatility does exist within the confines of a secular upward or downward trend. Low volatility can be used to diagnose complacency among investors and vice versa. Also spurts in the VIX are buying opportunities, as was the case in May 2014 and October 2014.
How to trade Volatility
Volatility is misunderstood and misused in financial markets. Approximately 99 percent of the time, the single most important thing investors should do, is absolutely nothing. This is on the assumption that you are not leveraged. Volatility inadvertently throws up stock picking opportunities. Hence, its relevance has been reduced to being a ‘buying on the dip’ indicator. Volatility almost always signals a change in leadership. It can be used as follows:
-
You have a choice: to stay invested, or liquidate and leave. Here’s the problem. Leaving the stock market when it is volatile, is generally a bad idea. It’s done out of fear. People make the biggest investment mistakes when they’re fearful. It’s even more powerful than greed.
- In the long run FII (Foreign Institutional Investors) money controls the market. Currently they are buying debt. Since there is so much uncertainty, it does make sense to allocate a portion of your investable surplus to debt instruments. In a falling interest rate scenario, do not under-estimate the returns that debt can give. In 2014, in the United States, the debt market comfortably outperformed equities. There are plenty of debt instruments which are listed on the NSE.
- Traditionally FII favourite sectors have been software and private sector banking. In the market, whenever the Bank Nifty starts falling, the information technology stocks start moving up. The situations when both these sectors are on a tear, are few and far between.
- If one keeps waiting for some Nifty level to be reached, let me assure you that you might end up waiting endlessly. Some stocks have corrected as much as 20 percent. The index on the other hand has not even corrected 5 %. The funny thing about all this is, you don’t need to look at the VIX, Nifty, Bank Nifty or anything else. All you have to do is look at stocks themselves—nothing fancy.
- In the market’s, volatility acts like a rubber band. It stretches outwards in times of duress and relaxes when panic has subsided. So when there is a spike in volatility, start looking for what to buy. Within your existing portfolio, identify the winners. How much have they corrected relative to the index? The next thing, is to add to your winners on every fall in the index. No research required, should work like a dream.
- What if this ‘time it’s different?’ If you believe the stocks may not come back this time, then you have much more to worry about than your investment portfolio.
- The VIX high low in each if the calendar years is shown in the table below. In the current year the high and the low of the VIX are 19.07 and 13.15. We have had monetary easing by one central bank or another for the entire period shown below. Even if you ignore the election years, the VIX does show a tendency of spiking to somewhere between 20 and 25 each year. That can easily happen this year as well. (The VIX closed at 15.96 on Friday, 09 January, 2015).
| YEAR | VIX-HIGH | DATE | VIX-LOW | DATE |
| 2009 | 56.07 | 19-May-09 | 22.94 | 24-Dec-09 |
| 2010 | 34.37 | 25-May-10 | 15.22 | 06-Sep-10 |
| 2011 | 37.19 | 04-Oct-11 | 16.73 | 01-Jun-11 |
| 2012 | 28.92 | 05-Mar-12 | 13.04 | 22-Oct-12 |
| 2013 | 32.49 | 03-Sep-13 | 13.07 | 07-Mar-13 |
| 2014 | 37.71 | 09-May-14 | 11.57 | 22-Sep-14 |
What does all this volatility mean?
1.Volatility doesn’t wear a sign around its neck or announce its arrival in advance. It simply arrives, in a different guise, every time. What does this mean for the markets? What does it mean for investors? There’s absolutely no way of knowing, there are only guesses.
2. The current spell of volatility is likely to continue till the end of the month. The reasons are: the European Central Bank’s announcement of policy (read monetary easing) on January 22nd. The uncertainty does not end there. Greece goes to the polls on January 25, 2014. The party favored to win, is in favor of Greece exiting the Euro-zone. So I suppose it will be a roller coaster till then. All in all, we are set for an exciting month ahead.
3. Just remember, in financial markets they say that: ‘there is never one cockroach’. Just seeing one cockroach does not tell us how many of them are there. What that means is that we know only about the visible factors, like Greece etc. What about the unknowns?
3. The arrival of this new wrinkle in the narrative will cause some people to change their behavior, or to react in different ways. It will mean any or all of the following:
- Sales and purchases of various securities and hedges.
- Some reactions in other asset classes.
- Plenty of commentary in the financial media firmament. It will cause some people to change their minds about some things, while strengthening the convictions of others.
- A few of those who move based on this news, will get the impact right, a few will get it wrong. Some will overreact, some will wish they had reacted more quickly or forcefully or not at all. Only time will tell whether or not this event will signify nothing or everything.
3. You have a choice, go ahead and read them all, if they make you feel a little less bad about losing money. In the end, you are going to do what you are going to do.
4. Be thankful for the bouts of uncertainty. Rejoice in these reminders of risk. To paraphrase Dolly Parton, (the famous Hollywood actress and singer of yesteryear) : “The way I see it, if you want the rainbow, you gotta put up with the rain.”