The increase or decrease in the price of a stock pursuant to it being added to or dropped from a benchmark index is known as the index effect on the price of the stock. I have tried to quantify the ‘Index Effect’ on the inclusions and exclusions in the Nifty 50 benchmark index.
The Index Effect
Before I get into what is presented, a bit of background information is essential. India Index Services and Products Ltd (IISL) owns and manages the Nifty 50 and allied indices. The criteria for selection of eligible stocks is clearly notified and followed. Index maintenance plays a crucial role in ensuring that the Nifty 50 meets its objective of being a benchmark for the Indian Stock Market on a continuous basis. As part of the index maintenance, the index is reviewed every six months. The changes in the composition are announced. IISL gives a four weeks clear notice of the proposed changes.
In other words, the market ‘knows’ of the coming changes roughly a month before the date that the changes take effect. Needless to say, these impending changes are ‘priced’ almost immediately. Hence, what I have done is as follows:
- I have compiled the list of inclusions and exclusions, into and from the Nifty 50 for the period from 01 January 2009 till 01 April 2016. I have referred to the date from which these inclusions and exclusions are to take effect as the Event Date (ED).
- I have computed the returns for these stocks for the six weeks preceding the event date and six weeks post the event. To gain some additional perspective, I have calculated the returns for the six months following the Event Date.
The table showing the Index Effect for the Nifty 50 for the period from 01 January 2009 to 01 April 2016 looks like this:
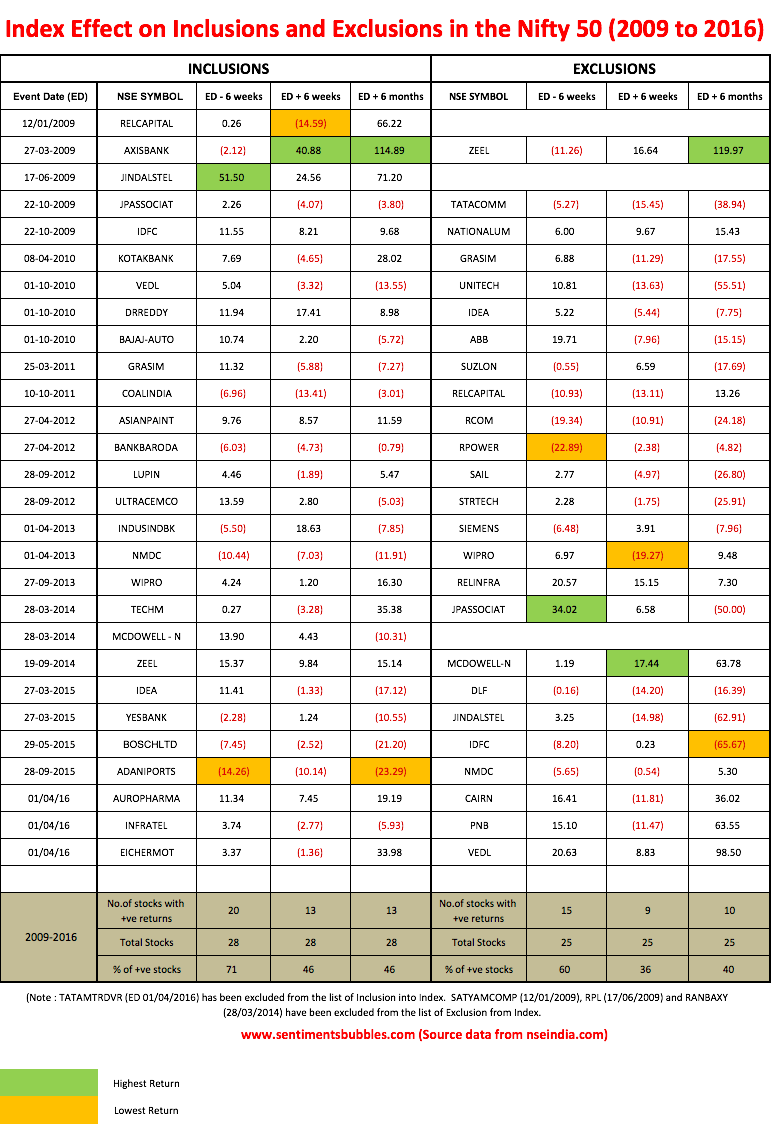
In the image above, the highest and lowest returns in the respective periods have been highlighted. It is easy to draw the following conclusions:
- In the case of the stocks that were excluded from Nifty, the percentages seem to suggest that there is a negative bias in the six weeks that precede the event date. The percentage of stocks with positive returns would have dropped to 53.50 percent if exclusions on account of mergers and acquisitions were to be considered (as explained in the note below the table).
- Does the exclusion of a stock reflect on its quality or financials? I don’t think so. A perusal of the methodology seems to suggest that deletions from the Index composition are because of the fact that, regarding eligibility ranking, there is some other stock that is ranked higher than the one that is deleted. Since benchmarks are weighted by market capitalization, an exclusion would indicate that money managers are staying away from the stock due to a variety of concerns. In other words, exclusions from the Nifty 50 would highlight underperforming stocks.
- Is buying stocks that are so excluded a prudent stock-picking strategy? It would be tantamount to buying underperforming stocks or buying the unloved. I think that any such strategy is a bit risky. The reason is that, at an individual stock level, markets tend to be ruthlessly efficient. Whenever we buy or sell an individual stock, we are likely to be trading with someone who is smarter and better informed than we are. In real time, we don’t know if we are buying to or selling from ‘them.’ The analysis does tend to highlight the sectors that are clearly out of favor. In other words, exclusions may at times indicate an inflection point for the sector, more than for the stock.
- In the case of the inclusions, it is evident that price pressures seem to start building up even before the announcement of changes is made. An overwhelming seventy-one percent of the stocks that were included showed an appreciation in price in the six weeks before the changes took effect.
- The analysis does seem to indicate that there may be some ability of market participants to anticipate the companies that are going to be included and excluded. In my opinion, quantitative strategies and algorithms can be used to prepare a list of probable stocks that might be so included or excluded. It is very likely that this is already being done by ‘them.’
- Index Funds track the benchmark composition. Hence, they have to realign portfolios to adjust for changes made in the Nifty 50 structure. A bulk of the price action in the six weeks post the event date can be safely attributed to Index Funds.
- Among the inclusions, of the twenty names that had positive returns in the six weeks preceding the Event Date, ten names had negative returns in the six weeks post the Event Date. Of these ten, three names posted net negative returns at the end of six months from the Event Date. In the case of the exclusions, of the ten names that had negative returns in the six weeks preceding the event date, four names had positive returns in the six weeks post the event date. Of these, two names posted net positive returns. I think these statistics highlight the fact that changes in Index Constitution do not have any lasting effect. The reason is not hard to find; historical prices form the basis for changes in Index composition whereas markets are forward-looking. The Index Effect, if any, is ephemeral.
Conclusion
The markets ended the week with a pause in the up move. Will it be the ‘pause that refreshes’? We wouldn’t know until it’s too late. Most of the commentary is focussed on the valuation metric and how global markets are overvalued. The ubiquity of the data means that almost everyone is looking at the same set of numbers. I think thats futile. We tend to forget that stock markets are run by feelings (sentiments) and not by figures; Sentiment always follows price action and nothing fuels sentiment like rising stock prices. In times like these, it helps to remember that there always have been times like these.
Very well written article, and thanks for the chart showing the index effect. keep posting such informative article.
Thanks
Yashodhan
Well researched and articulate!
Thanks
Worth reading. Excellent analysis.
Thanks