
The concept of share weighted portfolios means that one buys an equal quantity of all the shares in one’s portfolio, without any regard to their market price.
Nifty 50 as a benchmark – Background Information
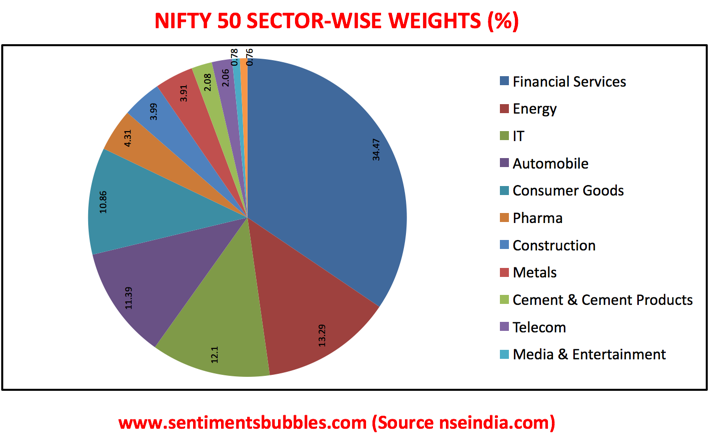
The Nifty 50 consists of fifty stocks and accounts for twelve sectors of the Indian economy. It tracks the behaviour of the largest and most liquid Indian corporates and captures approximately sixty-five percent of the float-adjusted market capitalisation of the Indian Stock Market. In this way, it is an accurate reflection of the Indian Stock Market. The Nifty 50 is a market capitalisation weighted index. What that means is that larger companies account for a greater portion of the index. The composition of the Nifty 50 benchmark Index and the sector-wise asset allocation within is shown below.
Does asset allocation trump stock selection? A lot is written about the fact that optimal sector-wise asset allocation can lead to improved portfolio performance with lower volatility. In fact, some commentators seem to think that asset allocation accounts for ninety percent of the generated returns. Without getting into the weeds, the conventional wisdom is that asset allocation matters. In other words, asset allocation within the pie is critical for generating Alpha. What if one were to ignore all the mumbo-jumbo about asset allocation, and construct a portfolio that breaks this link between price, weight and sector?
Share-Weighted Nifty 50 Portfolio
(Click on the Image to Embiggen)
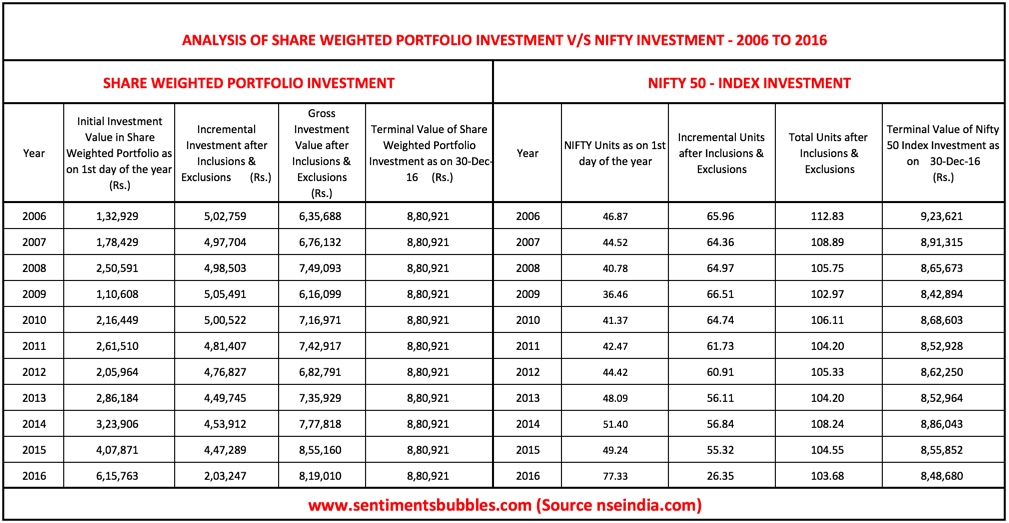
I have used the Nifty 50 Index for building a share-weighted portfolio of 50 stocks. It is share-weighted: holding the same number of stocks in each company regardless of price. In the table shown above, what I have done is as follows:
- To begin with, the Do It Yourself (DIY) investor, buys ten shares of each of the Nifty 50 component stocks on the first day of the year. In this way, in the year 2006, he or she would have ended up investing Rs. 132,929.
- The National Stock Exchange of India (NSE) periodically announces a list of stocks that have been included and excluded from the Nifty 50 composite. Hence, the share-weighted portfolio is adjusted for these inclusions and exclusions on the date that they took effect. The net result of these yearly changes (in Rupees) is shown, and the ‘Gross Investment’ in the share-weighted portfolio is arrived at. To illustrate, in the first row, Rs.5,02,759 would be the net incremental investment made over the next ten years, (until 30 December 2016). An investor who started investing on the first day of the calendar year 2006, would have ended up investing a total of Rs. 635, 688 before the portfolio was liquidated. Apart from adjusting for these inclusions and exclusions, no other market activity is undertaken.
- Since Rs. 132,929 is being invested on 01 January 2006, for comparison purposes a similar investment is made in the Index (Nifty 50). The Nifty value as on the first trading day of the calendar year 2006 was 2835.95. As a result, 46.873 units of the Nifty 50 are considered as bought on that date. It is assumed that Nifty units (equivalent to the Rupee value of the inclusions and exclusions) are purchased on the respective dates. Hence, the ‘Gross Investment Value after Inclusions and Exclusions’ remains the same in both the types of investments that have been compared. It ensures an apples-to-apples comparison of the processes used and the returns therefrom.
- To be clear, the first row, representing the year 2006 shows the returns that would have been obtained by an investor who began his investment on the first trading day of 2006. If an investor were to start this experiment on the first day of the subsequent calendar years, the results are shown in the sequential rows. For both the portfolios, dividends have been ignored.
- Both the portfolios are liquidated on 30th December 2016. The ‘Terminal Values’ are shown alongside the respective portfolio. In the case of the share-weighted portfolio, irrespective of the date on which this experiment is started, the portfolio composition would mirror that of the Nifty 50. Hence, the terminal values remain the same in all cases.
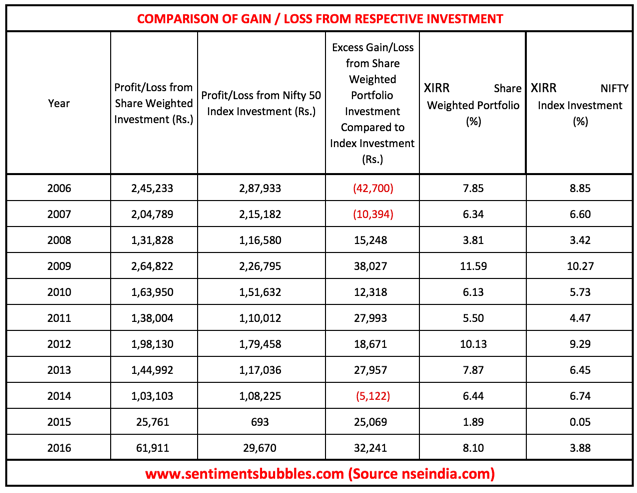
- I have calculated the return percentages for both the portfolios. The share-weighted portfolio outperforms in eight of the eleven years. Though the magnitude of outperformance is narrow, the frequency is very high.
(Click on the Image to Embiggen)
Conclusion
I was surprised by the results. Reason being, the strategy adopted can be described as simplicity personified, bordering on the dumb. But it seems to add value most of the calendar years. In the current year as well, the share-weighted portfolio is outperforming the Nifty 50 as on date. I would have been less surprised if the results were not as one-sided as they appear. The amount invested and the stocks are the same in both the portfolios. What differs is the weight of the stocks and the weight of the sectors that these stocks represent. Share-weighted portfolios break the link between the portfolio and the market prices of the component stocks. That seems to be the primary reason why a share-weighted allocation substantially outperforms the Nifty 50. My thoughts:
- The Nifty 50 is not a random collection of stocks. The components of the Nifty 50 are among the largest companies in corporate India. They have passed qualitative tests before they have been included in the composite. In other words, in a Nifty 50 share-weighted portfolio one does inadvertently end up buying high-quality stocks.
- All benchmarks (including the Nifty) are human-made and market capitalisation weighted. All market capitalisation weighted benchmarks suffer from an inherent flaw; an investor who tracks the benchmark would end up owning more of what just went up and less of what went down. That is a very artificial construct.
- Market capitalisation weighted benchmarks also seem to make the assumption that market prices are correct. In the short-term, that is an intuitively incorrect assumption to make. In the short-term, markets tend to overpay for good news and excessively discount bad news. In the long-term, prices tend to mean revert and markets tend to get it right.
- Share-weighted portfolios tend not to overweight overvalued stocks and underweight undervalued stocks. In fact, any strategy that counteracts these inherent flaws of a market capitalisation weighted index is likely to win. The reason it tends to work over the long-term is that by default you are making a contrarian trade – you are not chasing performance, and that is a very powerful way to invest.
- Generating Alpha in the investing world is a function of how much a portfolio deviates from its stated benchmark. The share-weighted portfolio does indirectly achieve this objective.
I think that share-weighted portfolios, expose benchmarking for what it is – a massive waste of time. In spite of the fact that benchmarking serves no useful purpose, investors (along with their money managers) are obsessed with beating their stated benchmarks. At the same time, in the investing world, there is unanimity on one thing; nobody and I repeat absolutely nobody wants a benchmark that is hard to beat. A share-weighted portfolio allocation seems to show that, over the long-term, it is relatively easy to beat the benchmark. I think that share-weighted portfolios appear to prove the adage: `It ain’t what you do, it’s the way that you do it.’’