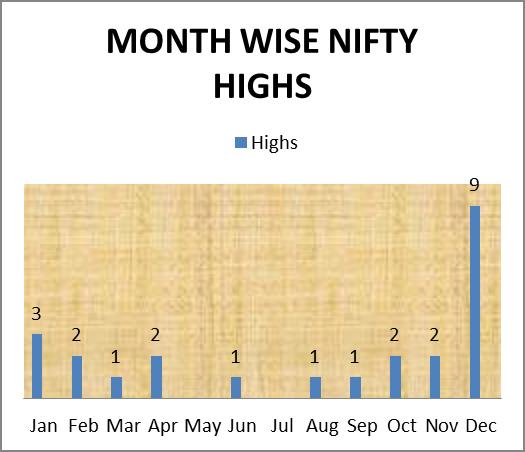
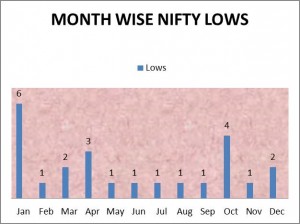
Every year this catchy phrase of sell in May and go away has become a media favorite. This is an American saying and the complete version is ”Sell in May and go away. Stay away till St. Leger’s Day”, and it effectively means that there is no point owning stocks in the (American) summer. Incidentally St Leger’s day is in September. In the Indian scenario the media has adopted it very quickly and has been extensively used in the month of May practically every year. The reality in India is that investors have really taken this adage to heart and have conveniently forgotten the word ‘May’ and have actually abandoned the capital markets in the last five years and have really gone away. Is there any semblance of veracity to the sell in May and go away syndrome? The more usual pattern is for tendencies to stop once they are widely discovered and emulated. The following table shows the Nifty calendar highs and lows and the months in which they have occurred from 1990 till date. (The reason behind doing all the hard work is to find out whether May is a good time to buy instead of sell)
It is clear from the above that the Nifty has made its calendar year high in the month of December on 9 occasions i.e. 37.5 % of the time so assuming (correctly) that we are all trying to sell at the top and buy at the bottom the best month for selling should be December and not May. It is significant to note that the Nifty has NEVER made its calendar year high in May, in fact in 2004 (Election Year) it made a low in May. The fact of the matter is that once the market knows that people are trading on such adages the market tends to behave differently and this being one of the most popular and well known adages, to find out whether the market still subscribes to this adage i have sliced and diced the past data. Reams have been written about how investors should not try and time the markets but the reality is that almost every investor tries to, in the process he is swayed by the media and would be well advised to look at the data instead. I do not wish to get into the do’s and don’ts of timing the market in this post but in the investing world everybody has an opinion. (This is very different from other professions where people blindly listen to the advice of professionals eg Doctors, Chartered Accountants and Lawyers). In view of this, the analysis done in this post might help to arrive at a decision. It is important to remember that this is an empirical study and should be viewed as such, at the same time it is not a bad idea to invest in accordance with empirical evidence rather than in opposition to it. If one had invested in Nifty at the high for the month of May and sold it at the high in the month of December the returns would look like this:
YEAR MAY DEC % RETURNS
2003 |
1006.80 |
1879.80 |
86.71 |
2004 |
1832.80 |
2080.50 |
13.51 |
2005 |
2081.55 |
2842.60 |
36.56 |
2006 |
3754.25 |
4015.95 |
6.97 |
2007 |
4295.80 |
6159.30 |
43.38 |
2008 |
5228.20 |
3077.50 |
-41.14 |
2009 |
4448.95 |
5201.05 |
16.91 |
2010 |
5222.75 |
6134.50 |
17.46 |
2011 |
5701.30 |
5062.60 |
-11.20 |
2012 |
5239.50 |
5930.90 |
13.20 |
2013 |
6187.30 |
6363.90 |
2.85 |
At least the past data clearly shows that Sell in May and go away is a load of b***shit.
EXPECTED SEAT ALLOCATION AS PER THE GREY MARKET
1. Madhya Pradesh – 26/29,
2. Uttar Pradesh – 50/80,
3. Andhra Pradesh – 26/42,
4. Arunachal Pradesh – 1/2,
5. Assam – 7/14,
6. Bihar – 30/40,
7. Chattisgarh – 11/11,
8. Goa – 2/2,
9. Gujarat – 24/26,
10. Haryana – 4/10,
11. Himachal Pradesh – 1/4,
12. Jammu and Kashmir – 1/6,
13. Jharkhand – 10/14,
14. Karnataka – 18/28,
15. Kerala – 4/20,
16. Maharastra – 35/48,
17. Manipur – 0/2,
18. Meghalay – 0/2,
19. Mizoram – 0/1,
20. Nagaland – 0/1,
21. Odissa – 7/21,
22. Punjab – 8/13,
23. Rajasthan – 23/25,
24. Sikkim – 0/1,
25. Tamilnadu – 8/39,
26. Tripura – 0/2,
27. Uttarakhand – 4/5,
28. West Bengal – 12/42,
29. Delhi – 6/7,
30. Andman – 0/1,
31. Chandigarh.- 1/1,
32. Dadra Nagar – 0/1,
33. Daman, Diu- 0/1,
34. Lakshadeep – 1/1,
35. Pondicheri – 0/1,
TOTAL = 317/543
I think the above is a tad optimistic, nevertheless it can give an idea of what the ‘satta’ market is expecting and could help in factoring individual market perceptions. The main cue is the exit polls on the 12th of May and that can be a good time to take a call on exiting the market or staying invested. In any case click here to read what to expect if the NDA comes to power.
APRIL MARKET RECAP
The Cnx Nifty was virtually flat for the month but that hides the underlying volatility since the high low range for the Cnx Nifty was 6840.80 on 23rd April, 2014 and a low of 6675.30 on 16th April, 2014. The best performing sectoral index was the PSU bank index followed by the Pharma index as can be seen below.
| INDEX | 31-Mar-14 | 30-Apr-14 | % CHANGE |
| CNX NIFTY | 6704.2 | 6696.4 | -0.12 |
| CNX BANK | 12742.05 | 12855.85 | 0.89 |
| CNX AUTO | 5803.2 | 5866.5 | 1.09 |
| CNX ENERGY | 8329.45 | 8310.8 | -0.22 |
| CNX FINANCE | 5273.65 | 5308 | 0.65 |
| CNX FMCG | 18085.25 | 17573.25 | -2.83 |
| CNX IT | 9298 | 9227.95 | -0.75 |
| CNX MEDIA | 1793.25 | 1740.45 | -2.94 |
| CNX METAL | 2520.65 | 2501.2 | -0.77 |
| CNX PHARMA | 7630.4 | 8100 | 6.15 |
| CNX PSU BANK | 2738.65 | 2973.15 | 8.56 |
| CNX REALITY | 189.05 | 179.2 | -5.21 |
| INDIA VIX | 21.62 | 30.59 | 41.48 |
| GSECBM NSE INDEX | 1159.19 | 1166.05 | 0.59 |
BLOGROLL
Non-advised retail financial products are usually toxic – Good Read
7 silly things we do with smartphones
A Top Formation in S&P 500 Index (U.S.Markets)
The information in this blog post represents my own opinions and does not contain a recommendation for any particular security or investment. I or my affiliates may hold positions or other interests in securities mentioned in the Blog post, please see my Disclaimer page for my full disclaimer.


