
(Cartoonist: Wise and Aldrich; Cartoonstock.com)(Sunday, 8 May 2016)
Mutual Fund investments have gained in popularity and are now the preferred route for a retail investor. While deciding to invest in a mutual fund, investors compare the degree of outperformance between the Mutual Fund returns and their stated benchmarks.
Mutual Fund v/s Benchmarks
Before reading the table below and the analysis, I need to highlight the following:
- Mutual Funds in India are unconstrained. What do I mean by ‘unconstrained’? Mutual Fund managers are not restricted to the composition of their benchmarks for stock selection. In many cases, not only is the stock selection outside the benchmark, it is outside the Nifty 500 as well. Hence, the entire universe of Indian Mutual Funds is ‘unconstrained’.
- While comparing mutual fund performance, one should look at the five-year rolling returns. Rolling Returns take care of the Systematic Investment Plan (SIP) investing methodology. Unfortunately index values for the Nifty 500 Index are available only from 01 March 2013 onwards. As a result, I was unable to compute the five-year Rolling Returns. What I did instead, was to calculate the three-year Annualised Returns. I don’t think it will affect the conclusion that I reached in any material manner.
- In the table below, I have selected the top ten Growth Funds ranked by Average AUM. The total of the Average Assets Under Management (AUM) of Growth funds for the quarter from January to March 2016 is Rs. 32827737 lakhs comprising 1859 Growth Funds. The sample selected accounts for an Average AUM of Rs. 6407707 lakhs, roughly 20 percent of the total AUM of Growth Funds. I think this is a representative sample size. The Average AUM data used is for the period from January to March 2016. (Source: Association of Mutual Funds in India) and the Annualised Returns are computed as on 31 December 2015.
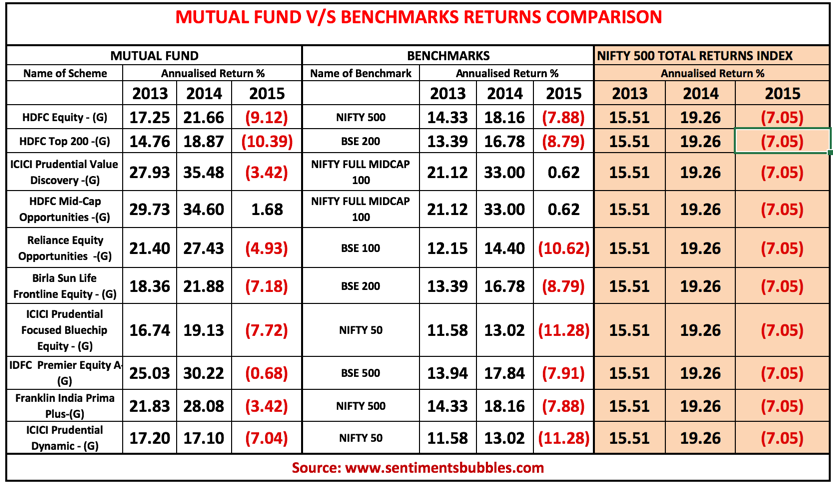
The outperformance of the Mutual Funds seems apparent. I think the table is self-explanatory, and each one is free to draw his or her conclusions. In the image above, in some cases the margin of outperformance is so large that it got me thinking; how useful are the benchmarks? A fund manager beating the benchmark by a couple of points is what outperformance is all about. Beating a benchmark has to be challenging, it cannot be a walk in the park. When a group of indices outperforms the benchmark and consistently so, it is time to question the quality of the benchmark itself. With this mind consider the following:
1. A benchmark is a barometer against which a fund’s performance is measured. It is supposed to be an investing lifeline. If a fund’s returns exceed those of its benchmark, it is referred to as outperformance. As a result, all Mutual Fund managers are continuously tracking the performance of their fund portfolios vis-a-vis their respective benchmarks.
2. Since fund management is unconstrained, all Mutual Fund schemes consist of stocks that don’t form part of their stated benchmarks. Hence, outperformance is a fait accompli. Inadvertently, it results in the bar for Mutual Fund outperformance to be set at a very low-level.
3. Just as one compares performance (or the lack of it) in any field with the ‘best in class’, in investing as well, one must compare performance with the best performing broad market index. What does the ‘classsroom of indices’ look like and what is their performance? This is shown below:
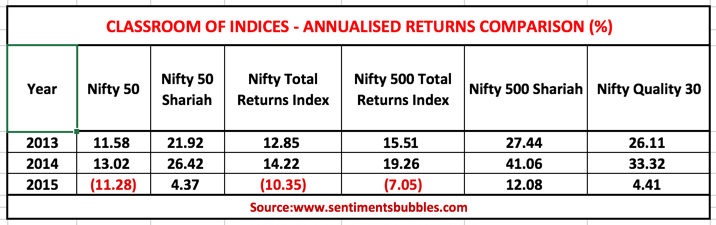
4. It is apparent that the benchmark (Nifty 50) that is being used for measuring performance is not exactly the ‘best in class’ index. In my opinion, measuring performance against the Nifty 50 is incorrect. A more competitive ‘returns bar’ needs to be set.
5. In other words, Fund Managers of Indian Mutual Funds need to either raise the ‘returns bar’ for measuring outperformance OR Indian retail investors need to raise the ‘expectations bar’ for their Mutual Fund investments.
6. To be fair, both the Nifty 500 Shariah and the Nifty Quality 30 do not fall under the category of ‘Broad Market Indices’. However, the Nifty 500 Index is a Broad Market Index. Hence, for measuring Mutual Fund performance, investors must use the Nifty 500 Total Returns (TR) Index (highlighted in the table above) and not their stated benchmarks or the Nifty 50. The reasons are:
- Since Mutual Fund managers are unconstrained in so far as stock selection is concerned, investors need to compare the fund returns with the returns of Indian Stock Market as a whole. The Nifty 500 Index represents about 94 percent of the free float market capitalization of the stocks listed on National Stock Exchange of India Limited (NSE).
- Indian Mutual Funds earn dividends from the stocks that they hold. Investors need to account for dividends in their comparison metric. Since the Nifty 500 Total Returns Index accounts for dividends earned, it ensures a fair comparison yardstick.
7. To conclude, we seem to be in sync with the developed world regarding the use of strategies like algorithmic trading and options. However, benchmarking has plenty of catching up to do.
Mind the Gap
Can a Mutual Fund win and it’s investors lose? In the table above the time-weighted returns of 10 Mutual Fund schemes have been shown. It is the return you would have earned had you invested a lump sum in the fund on 01 January 2013. Then, to match the fund’s performance, you’d have to have held onto these Mutual Fund units without making any changes. This is the utopian scenario. Real-world investing is messier. Investors try to time their investments. They add to or redeem units at periodic intervals. It results in a gap between the returns that investors earn and the returns of the Mutual Fund scheme in which they have invested.
Research shows that the returns that investors have received over time are much lower than the returns of the instrument that they have chosen. It is called the ‘returns gap’ or the ‘behaviour gap.’ I prefer to call it the Behaviour Gap since the difference in returns is entirely attributable to human behaviour. In other words, the Behaviour Gap is the gap between investor returns and investment returns. The question is how much is the Behaviour Gap in percentage terms?
An agency by the name of Dalbar engages in what they call ‘Quantitative Analysis of Investor Behaviour.’ According to them, the behaviour gap is as high as eight percentage points in the developed world. This proportion has been contested, and methods used by Dalbar have been questioned. Major fund houses and analysts seem to think that the Behaviour Gap would account for three percent of the returns. In other words, things are not as bad as Dalbar seems to suggest. However, the fact that there is a ‘Behaviour Gap’ is universally accepted.
How can one guess the extent of the Behaviour Gap in Indian markets? To try and guess the magnitude of the Behaviour Gap, I collated the data for investment by Foreign Institutional Investors (FII’s) and Domestic Institutional Investors (DII’s) for the calendar years 2013,2014 and 2015. This is shown below:
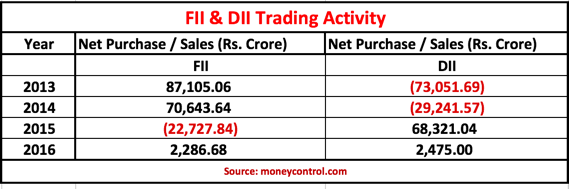
It is apparent that for the calendar years 2013 and 2014, DII’s were net sellers. It means that the Indian retail investor was a net seller in the Indian Stock Market for these two years. Have they then earned returns commensurate with those shown in the table? I don’t think so. The behaviour gap, in my opinion, would be skewed to the upper end of the range mentioned above.
It does seem to me that investment results are more a function of investor behaviour than fund performance. It is apparent that those who just held on to their investments were more successful than those who tried to time the market. The Behavior Gap illustrates the effect of mixing human emotions with investment strategy. I think this is what Benjamin Graham was referring to when he wrote these words: “The investor’s chief problem and even his worst enemy is likely to be himself.”
Good write up… I think one should treat MF investment is for longer term than shares. Because your investment is for underlying bunch of stocks depending on the theme of scheme. Of course it reduces your portfolio risk than your single or few stocks . Again MF schemes are well engineered by qualified and experienced fund managers / analysts who may apply their knowledge to max. returns to investors than its peers. If you are trapped in high NAV in lumpsum purchase, then very well one can average the same fund at lower NAV. Generally SIP ( period min 10 yrs if started in bullish phase ) is another best tool for investment for longer term say for “retirement corpus” rather than shares
True. It is good that investors are now using the MF route.
Very informative writeup. My experience is its an 7 years cycle of peak and lows. So if you hold for 7 years then the returns will be above 10 % PA. Nobody can time the market. I invested in MF s in 2014 Aug to Dec at 27000 index. Today, I have negative returns and my value of portfolio of MFs is 90 % of invested amount. So I have to wait till market climbs to 30000 atleast. So average returns will be atleast 10% PA. but exit is equally important otherwise portfolio value again goes down with time.
I think the fund selection is critical. Ideally, a fund that mirrors the Nifty 500 is the best option for an SIP strategy. See this link http://www.moneycontrol.com/mutual-funds/nav/goldman-sachs-cnx-500-fund/MBM023. The CNX 500 is the OLD NAME for what is now called the Nifty 500. You have a couple of variants there – with brokerage and without. Needless to say, the DIRECT option is the cheapest for an investor. You don’t find brokers selling this to you for obvious reasons.
Equity Mutual funds have problem of investing in many stocks in diverse sectors. Probably because they have to look in to reducing the risk. That’s why we could hardly earn between 10 to 12% p.a., even if the fund performance remains excellent.
Behavioral aspect plays very vital role while investing in stocks. If you select between 5 to 7 stocks in your portfolio; you can build your investment in quantity and which may lead you to give fabulous returns, say up to 20% p.a. e.g. Currently, if an investor dedicatedly invests in United Breweries, Kitex Garments, Wabco India, Yes Bank, Meghmani Organics, Kaveri Seeds; I don’t foresee any reason, why an investor may not earn the desired return.
Comparing fund performance with Nifty is a complete eyewash and one shall not carried away with their annualized returns – figures.
True. I think it is just too easy to beat the benchmark, has to be made more challenging.