We finally had a meaningful correction in the Nifty last week. The inevitable correction which most investors have been waiting for has thus begun. Since many investors had been left out of a rising market, I presume there must be a sense of relief at the onset of a correction. When the market goes up everybody wants a correction. When it goes down there is the usual post-mortem of the ‘why’. What surprises me is that when a market is going up investors want it to correct so that they can buy and when it corrects nobody ends up buying, in fact they sell on the rise!! Why? Because everyone is convinced that it will crash. The question in the minds of most investors is whether this is the top of the current bull market. I think not. Even though we are in a bull market, it does not mean that the market isn’t prone to sharp corrections. Investors must get used to the volatility. The index hit an intra day and all time high of 7808.85 on 08th July 2014 and reversed course to close the week at 7459.6. Since the market close on the 08th of July was a good 132 points below the low on 07th of July, hence one can safely assume that we at least have a ‘intermediate top’ in place. In the last week, we did see some vicious corrections in the benchmark and sectoral indices as can be seen from the table below:
| INDEX | 11/07/2014 | 04/07/2014 | % |
| CNX NIFTY | 7549.60 | 7751.60 | -2.61 |
| CNX BANK | 14447.20 | 15556.15 | -7.13 |
| CNX AUTO | 6722.50 | 7153.20 | -6.02 |
| CNX ENERGY | 9443.20 | 10062.55 | -6.16 |
| CNX FINANCE | 6019.60 | 6388.65 | -5.78 |
| CNX FMCG | 18100.25 | 17846.45 | 1.42 |
| CNX IT | 9933.55 | 9866.95 | 0.67 |
| CNX MEDIA | 2058.90 | 2129.00 | -3.29 |
| CNX METAL | 3135.00 | 3392.15 | -7.58 |
| CNS PHARMA | 8819.05 | 8796.45 | 0.26 |
| CNX PSU BANK | 3406.20 | 3864.40 | -11.86 |
| CNX REALITY | 241.65 | 267.70 | -9.73 |
What does all this volatility and noise mean for the long-term investor? In one word, nothing. In market’s volatility is opportunity spelt differently. The long-term investor does not need to bother about tops and bottoms. Turning points are exceptionally difficult to identify, but when we are trading at all time highs the temptation is irresistible. The punditry is always trying to call the top so to say, but as I have been saying incessantly, it is impossible to predict market movements let alone call tops and bottoms. Some learned person has rightly said that “Tops are a process and bottoms are an event”. In fact it is far more difficult to call market tops than it is to call market bottoms. When the market bottoms out the dominant emotion is fear, whereas when a market tops out we generally see a combination of greed, euphoria and complacency. In the situation that we are in today, I find that fear of an impending market crash is a dominant theme among most investors. This does not mean that we are at the bottom, but it definitely means that we are not at the top. Where are we then? In the middle (obviously), and middles are tricky. Why? Because the market is likely to be devoid of any discernible direction. This is popularly referred to as a sideways market. It effectively means a period where there is no major movement in the benchmark indices and stocks gyrate on both sides. In a sideways market, when markets go near the top of the trading range you can expect profit booking and when they move towards the bottom of the trading range you can expect dip buying. The media prefer to call it “consolidation”. Investors will be well advised not to zig-zag with the market, rather they should zig when the market zags and vice-versa.
INVESTING AT THE TOP
In the current scenario the percentage allocation to equities within the average Indian household is abysmally low. There is a perennial fear among most investors of committing money to equity as an asset class. There is a joke which defines a correction as the next day after one buys stocks. Since the investing public is so afraid of buying into stocks I did an empirical study of the two asset classes, viz, the most hated one (Equity) and the most loved one (Gold). For the sake of comparison I have used the NIFTYBEES and GOLDBEES (both are ETF’s). The basic assumptions are as follows :
- I invested an amount of Rs. 10,000 in both these asset classes.
- The starting date is 08th January 2008. I have picked this deliberately since that was the date the Nifty made its last all time high. So, since everybody is convinced that a correction starts from the next day that they buy stocks I have chosen to accept this as the truth.
- An amount of Rs. 10000 is assumed as being invested on the 8th of every month beginning with 08th January, 2008 and ending on 31st March 2014. By way of example, on 8th Jan 2008 the Niftybees closed at 632.61, so Rs. 10000 invested at the close would fetch 10000 / 632.61 = 15.81 units which is shown in the QTY column. The returns look something like this:
NIFTYBEES
| DATE | 2008 | QTY | 2009 | QTY | 2010 | QTY | 2011 | QTY | 2012 | QTY | 2013 | QTY | 2014 | QTY |
| JAN | 632.61 | 15.81 | 288.55 | 34.66 | 525.85 | 19.02 | 585.01 | 17.09 | 482.57 | 20.72 | 604.23 | 16.55 | 624.34 | 16.02 |
| FEB | 521.01 | 19.19 | 293.28 | 34.10 | 478.89 | 20.88 | 539.74 | 18.53 | 542.11 | 18.45 | 592.77 | 16.87 | 614.79 | 16.27 |
| MAR | 482.82 | 20.71 | 262.40 | 38.11 | 512.89 | 19.50 | 558.47 | 17.91 | 535.72 | 18.67 | 599.78 | 16.67 | 657.38 | 15.21 |
| APR | 477.24 | 20.95 | 335.41 | 29.81 | 530.76 | 18.84 | 588.94 | 16.98 | 527.25 | 18.97 | 558.29 | 17.91 | ||
| MAY | 510.85 | 19.58 | 362.65 | 27.57 | 519.32 | 19.26 | 564.16 | 17.73 | 504.85 | 19.81 | 604.23 | 16.55 | ||
| JUN | 454.99 | 21.98 | 444.92 | 22.48 | 501.54 | 19.94 | 559.88 | 17.86 | 509.82 | 19.61 | 590.59 | 16.93 | ||
| JUL | 403.45 | 24.79 | 409.73 | 24.41 | 534.52 | 18.71 | 574.38 | 17.41 | 528.56 | 18.92 | 587.47 | 17.02 | ||
| AUG | 459.08 | 21.78 | 444.05 | 22.52 | 550.18 | 18.18 | 523.86 | 19.09 | 536.06 | 18.65 | 564.05 | 17.73 | ||
| SEP | 457.28 | 21.87 | 477.87 | 20.93 | 560.84 | 17.83 | 522.92 | 19.12 | 539.03 | 18.55 | 594.01 | 16.83 | ||
| OCT | 355.53 | 28.13 | 498.71 | 20.05 | 612.75 | 16.32 | 506.00 | 19.76 | 571.40 | 17.50 | 603.86 | 16.56 | ||
| NOV | 317.43 | 31.50 | 493.09 | 20.28 | 634.26 | 15.77 | 537.01 | 18.62 | 576.87 | 17.33 | 621.55 | 16.09 | ||
| DEC | 283.15 | 35.32 | 515.12 | 19.41 | 596.50 | 16.76 | 501.93 | 19.92 | 594.67 | 16.82 | 642.16 | 15.57 |
| TOTAL AMOUNT INVESTED | 750000.00 |
| LESS DIVIDEND RECEIVED | 38234.25 |
| NET INVESTMENT | 711765.75 |
| TOTAL NUMBER OF UNITS ACQUIRED | 1509.74 |
| MARKET VALUE ON 31ST MARCH 2014 | 1011526.05 |
| NET PROFIT | 299760.31 |
| % RETURN | 42.12 |
| ANNUALISED RETURN | 10.25 % |
GOLDBEES
| DATE | 2008 | QTY | 2009 | QTY | 2010 | QTY | 2011 | QTY | 2012 | QTY | 2013 | QTY | 2014 | QTY |
| JAN | 1092.17 | 9.16 | 1314.62 | 7.61 | 1650.62 | 6.06 | 1973.90 | 5.07 | 2654.30 | 3.77 | 2890.30 | 3.46 | 2740.05 | 3.65 |
| FEB | 1170.17 | 8.55 | 1389.65 | 7.20 | 1607.08 | 6.22 | 1958.40 | 5.11 | 2699.70 | 3.70 | 2882.80 | 3.47 | 2791.20 | 3.58 |
| MAR | 1286.78 | 7.77 | 1524.59 | 6.56 | 1664.42 | 6.01 | 2043.25 | 4.89 | 2659.95 | 3.76 | 2777.25 | 3.60 | 2805.25 | 3.56 |
| APR | 1198.86 | 8.34 | 1434.98 | 6.97 | 1642.92 | 6.09 | 2057.85 | 4.86 | 2687.80 | 3.72 | 2784.80 | 3.59 | ||
| MAY | 1178.09 | 8.49 | 1443.52 | 6.93 | 1708.20 | 5.85 | 2137.15 | 4.68 | 2766.90 | 3.61 | 2558.10 | 3.91 | ||
| JUN | 1257.67 | 7.95 | 1444.15 | 6.92 | 1878.90 | 5.32 | 2171.80 | 4.60 | 2789.10 | 3.59 | 2608.50 | 3.83 | ||
| JUL | 1303.99 | 7.67 | 1443.22 | 6.93 | 1809.25 | 5.53 | 2140.70 | 4.67 | 2821.65 | 3.54 | 2471.25 | 4.05 | ||
| AUG | 1206.32 | 8.29 | 1473.35 | 6.79 | 1783.10 | 5.61 | 2417.65 | 4.14 | 2823.45 | 3.54 | 2631.70 | 3.80 | ||
| SEP | 1162.73 | 8.60 | 1576.04 | 6.35 | 1878.70 | 5.32 | 2634.55 | 3.80 | 3051.65 | 3.28 | 2824.65 | 3.54 | ||
| OCT | 1334.70 | 7.49 | 1576.93 | 6.34 | 1887.05 | 5.30 | 2543.45 | 3.93 | 2954.15 | 3.39 | 2872.15 | 3.48 | ||
| NOV | 1157.28 | 8.64 | 1652.86 | 6.05 | 1958.85 | 5.11 | 2746.90 | 3.64 | 2983.05 | 3.35 | 2871.00 | 3.48 | ||
| DEC | 1231.18 | 8.12 | 1735.67 | 5.76 | 2004.60 | 4.99 | 2798.80 | 3.57 | 2961.80 | 3.38 | 2815.55 | 3.55 |
| TOTAL AMOUNT INVESTED | 750000.00 |
| LESS DIVIDEND RECEIVED | 0.00 |
| NET INVESTMENT | 750000.00 |
| MARKET VALUE ON 31ST MARCH 2014 | 1074824.42 |
| NET PROFIT | 324824.42 |
| % RETURN | 43.31 |
| ANNUALISED RETURN | 10.50 % |
The key takeaways are
- The fear that equity as an asset class is doomed are misplaced since the annualized returns on both are basically the same. I have taken 31st March, 2014 as the cut off date. If one considered 30th June as the cut off date, then Equity would be the clear winner for obvious reasons.
- There is an argument that individual stocks would tend to outperform both the ETF’s chosen above. This is factually correct but the trillion-dollar question is selecting the correct set of stocks. The ideal scenario is when one allocates an equal amount to both i.e. individual stocks and the Niftybees. However one should avoid buying individual stock names which are already part of the ETF composition to avoid an overlap.
- The very obvious advantage that a graded plan has is that one tends to buy more units when the market is in correction phase and this improves the buying average. This is also the primary reason why the returns on both work out to more or less the same. In the last 2 years Gold has stagnated or moved down. Effectively, one ends up buying the same number of units each month. In the case of the Nifty this is not true.
- The Niftybees gave a total dividend of Rs. 34 in the period whereas the Goldbees gave Nil. The reason for this is that in case of the Niftybees the underlying assets are dividend paying stocks. In the case of the Goldbees the underlying asset is Gold, which is a non dividend paying asset. In the above case, if dividends were to be excluded from the calculation, the comparative return for the Niftybees would be 35 % translating into an annualized return of 9.25 %.
- This effectively proves that even if one were to invest at the top, for the long-term investor it is not a doomsday scenario. Even though I have assumed that I am entering the equity market at the top and the commodity market at the bottom, the returns don’t pan out as badly as is widely perceived. Investment in stocks, even if badly timed does not work out to be a bad idea, after all. This will work for individual stock names as well, in fact, the results are likely to be superior. The assumption is that one has invested in fundamentally sound stocks.
HOW DOES AN ETF (EXCHANGE TRADED FUND) WORK
Since I have been talking about ETF’s in almost all my post’s I thought it might be a good idea to shed some clarity on how they work. An ETF is basically an index fund that is traded on stock exchanges like a stock. ETF’s generally track an index. In case any one wants to study how an ETF works click here. The following are the salient features:
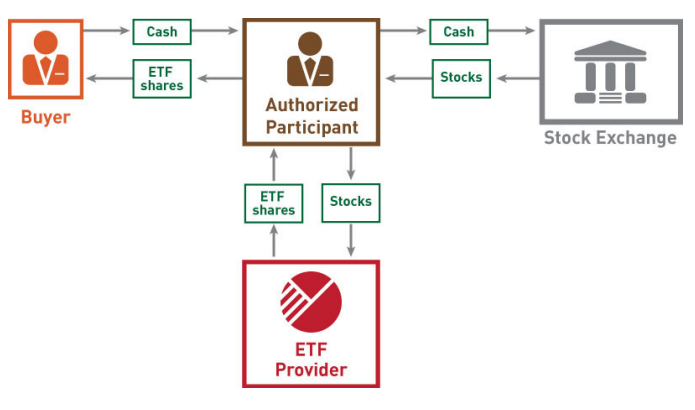
- ETF’s like traditional mutual funds, can create or redeem shares on a daily basis. In traditional mutual funds, the mutual fund company facilitates the creation and redemption of shares. In an ETF, Authorized Participants (AP) are brokerage firms that create and redeem ETF shares by delivering or receiving the ETF’s underlying basket of securities.
- Every night ETF providers send out a portfolio composition file. In the case of a purchase, when a buyer’s share amount exceeds the shares available in the market, Authorized Participants will buy the underlying securities that comprise the ETF and deliver those shares to the ETF provider. In return, the Authorized Participant receives ETF shares that are passed along to the buyer. It can pictorially be seen below

CONCLUSION
The fact remains that calling a top or a bottom is not a consistent way to make money. If someone is telling you that he or she has bought at the top and sold at the bottom then remember that it is a blatant lie. This cannot be done. In the investment world there is a popular adage which says ‘When in doubt get out’ . This is however, to be interpreted on the basis of whether one is under invested or fully invested. In reality, doubt is a more resilient emotion than hope. The under invested cling to doubt in bull markets. On the contrary the fully invested quickly abandon hope in bear markets. Are you fully invested in the Indian equity market?
[jetpack_subscription_form]
Sir who creates these ETF’s, what laws govern them, its still very unclear to a retail investor and hence for apathy. By the way are ETF’s linked to a sector or are they mixed bags?
ETF’ are linked to the index which they track, so there are ETF’s for NIFTY, BANKNIFTY and other sectoral indices. See the link in the blog and also this one http://www.nseindia.com/products/content/equities/etfs/cretns_redempns.htm.
traders or investors. we need to asceratain who we are. for investors no such level of top and bottom
traders and investors. we need to asceratain who we are. for investors there is no such top and bottom.
Well point taken in the above blog….
ETF…One of the good SIP product. When you buy Niftybees, actually you are buying bunch of underlying stocks . Its value is generally 1/10 th of spot price, depending upon demand/supply of stock and price movement is directly proportional to spot Nifty. So if mkt. is volatile, and nifty moves by 100 pts up and down, then in ETF , it translates to 8 to 10 rupees. which is negligible compared to high beta individual stock… It also then become the well diversified stock in your portfolio.. Same thing for Bankbees also…
Unfortunately ETF’s are not widely known, in fact many people don’t know how they work