
(Source : Cartoonresource/Shutterstock)
The stock market is at an all time high. Is it too late to enter? In my opinion, it’s just late, not too late. Many investors who cashed out feel that it is too late to buy, since they have missed out on the initial blast. In the first place, they decided to cash out because they felt valuations were unjustifiable. Those valuations, which they considered unjustifiable, have been stretched further. It is basically impossible to answer the question of where the index will be a year from now. The media are rife with index targets. For the rest of us, humble human beings (devoid of supernatural powers of prediction) we have to rely on past action and its analysis. In other words we have to do some work, instead of talking. I have proceeded to analyse the current situation on a couple of key metrics which are popular and time-tested. The importance of each, is not necessarily, in the order in which each of them has been stated. In other words, all of them are important.
Are Emerging Markets in a sweet spot?
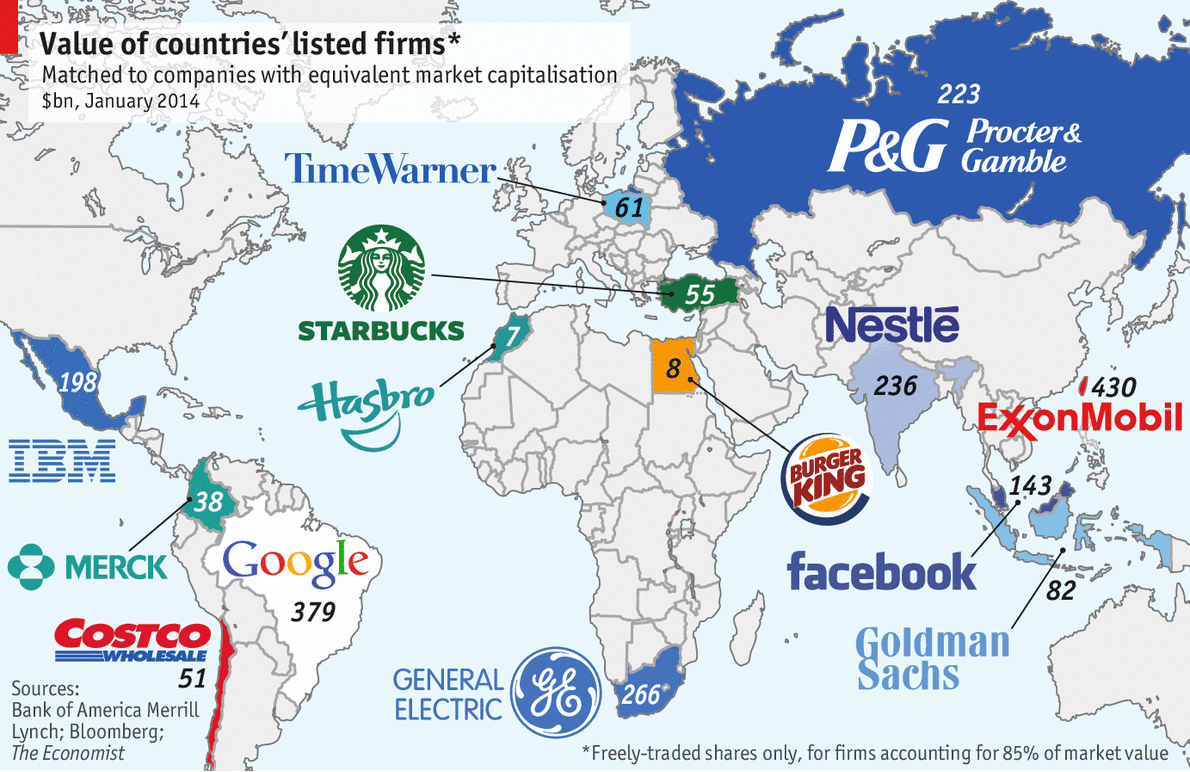
The graphic from The Economist below explains the reason we are experiencing strong FII inflows. It points to the fact that these flows are not only likely to continue, but are likely to get accentuated into a flood. In my opinion ‘flows’ are the single largest determinant of market direction. The article talks about all the freely traded shares of firms that feature in the local MSCI share index. With this criteria, the article goes on to state that the Indian market is roughly worth the same as Nestle (worldwide).
My interpretation of the above is
- In the developed markets, money managers see a massive opportunity in the emerging market space. The argument is that these markets have more room to grow compared to their counterparts in the developing and developed world.
- As is normal in markets, it is the expectation of growth than any visible growth that is driving ‘flows’ in to countries like India. The investing community in India is still looking for growth, whereas the FII community is investing on the basis of ‘expectations of growth’.
- To be fair, FII’s always look at diversifying their portfolio across the developed and emerging world. They have been underweight Emerging markets for too long. There are many who are ‘late’ and are now trying to catch up, lest they lose the opportunity.
- The table below shows the performance of the MSCI Emerging Markets index, since 01 January 2014 in one column and since 01 March 2014 in the next. The comparative statistics for the S&P 500 are also shown. It is clear that since March 2014, the MSCI Emerging markets index has outperformed the S&P 500 by over 7 %. The reason for the out performance since March 2014 is that in the first two months of the current year investors pulled more money out of emerging markets than they did in the whole of 2013. To put matters in the correct perspective, for the period from 2008 till the beginning of 2014, the S&P gave returns of 54 % and the emerging markets space gave returns of 1 %. Now maybe money is flowing from the developed world to the emerging world.
| INDEX | 1/1/2014 | 1/3/2014 | 1/8/2014 | %-01 JAN | %-01 MAR |
| S&P 500 | 1831.98 | 1845.73 | 1925.15 | 5.09 | 4.30 |
| MSCI EMERGING MARKETS | 1002.66 | 950.68 | 1060.12 | 5.73 | 11.51 |
The 200 Day Moving Average (200 DMA)
What is the 200 day moving average (200 DMA) and how is it calculated? In layman’s terms, it is the average of the closing prices of a security for the last 200 days. As the market moves higher, the moving average also moves higher. There are two methods of calculation, one is the simple average i.e. the arithmetical average of 200 days closing prices and the other is exponential. For the purposes of this post, the simple moving average has been considered. The graph of the Nifty and its 200 DMA is shown below.
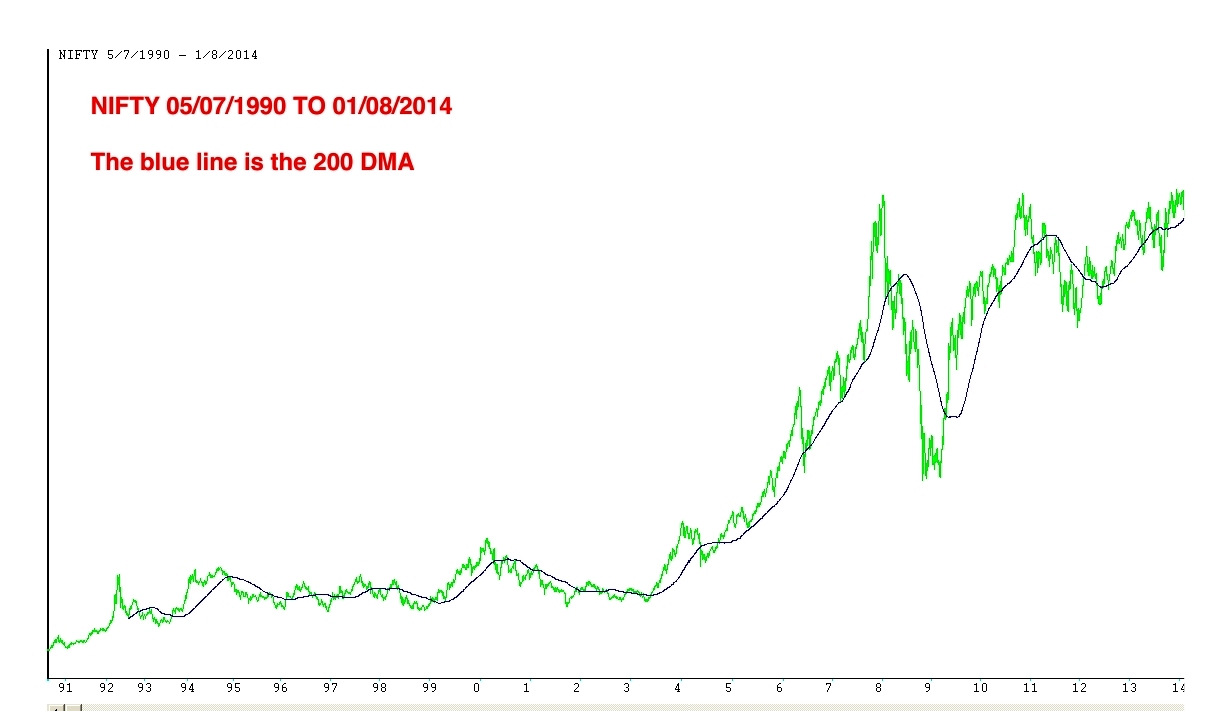
The 200 DMA is the dividing line between a market that is technically healthy and one that is not. In markets, when the current market price moves or stays above the 200 day moving average, it is considered bullish and vice versa. Many money managers do use the 200 DMA as a tool for deciding to stay bullish or otherwise. Hence, it would be insane to ignore it. The primary trend is considered to be bullish as long as the market trades above this level. This does not mean that the market just falls off a cliff as soon as the 200 DMA is broken on the way down. What I did, was to analyse the number of days that the market has remained above and below its 200 DMA since 1990. The table below shows the periods when the ‘no of days’ is more than 100.
| NIFTY WAS ABOVE 200 DMA | NO OF DAYS | NIFTY WAS BELOW 200 DMA | NO OF DAYS |
| 05 JUL 1990 TO 05 NOV 1992 | 454 | 06 NOV 1992 TO 10 AUG 1993 | 165 |
| 12 AUG 1993 TO 09 NOV 1994 | 277 | 10 NOV 1994 TO 04 OCT 1995 | 207 |
| 02 APR 1997 TO 27 OCT 1997 | 138 | 27 MAY 1998 TO 06 JAN 1999 | 157 |
| 10 FEB 1999 TO 03 APR 2000 | 291 | 07 JUL 2000 TO 19 JAN 2001 | 131 |
| 02 JUN 2003 TO 13 MAY 2004 | 242 | 02 MAR 2001 TO 04 DEC 2001 | 188 |
| 29 SEP 2004 TO 06 JUN 2006 | 419 | 06 MAY 2008 TO 13 APR 2009 | 227 |
| 24 JUL 2006 TO 08 FEB 2008 | 388 | 02 MAY 2011 TO 30 JAN 2012 | 188 |
| 29 APR 2009 TO 18 MAY 2010 | 259 | ||
| 10 JUN 2010 TO 25 JAN 2011 | 161 | ||
| 30 JUN 2012 TO 03 APR 2013 | 169 |
Nifty was launched in 1994 but was back tested, hence data from 1990 is available and has been used for this analysis. A total of 5790 days are considered for the exercise. It is found that, of these, on 3726 days the market has traded above it’s 200 DMA and 2064 days it has traded below the 200 DMA. The key takeaways from the above are as follows:
- The above data clearly shows that the market has tended to remain above it’s 200 DMA more often than below it. In short, markets are up more often than they are down.
- The longest uninterrupted stretch when the market remained above its 200 DMA is 454 days. In comparison, the longest uninterrupted stretch which it spent below its 200 DMA is only 227 days.
- In the last bull run from 2003 to 2008, the market remained above its 200 DMA for a record 1049 days, interrupted twice, by a brief period in May -Sep 2004 and Jun-Jul 2006.
- In the current bull run, the Nifty is trading above it’s 200 DMA since 03 Oct 2013, uninterrupted for the last 207 trading days.
- Apart from the Nifty which is making new all time highs the 200 DMA is also making new all time highs.
Also the percentage of stock above their 200 DMA helps determine the overall health of the market. On the basis of Friday’s closing prices CAIRN, INFY, JINDALSTEL and MCDOWELL-N are trading below their 200 DMA. Click here for the complete list.
Geopolitical concerns
A lot of people are also apprehensive on geo politics and the bearish pockets of news that keep getting published. I came across the following statistics published by J.P.Morgan. It analyses why geo politics is not hurting the market. In a note on War and Markets, J.P.Morgan gives the following statistics on the war zone countries as a percentage of GDP.
11.7 percent population
9 per cent oil production
3.8 per cent foreign direct investment
2.6 per cent trade
2.4 per cent gross capital formation
0.8 per cent corporate profit
0.7 per cent equity market capitalisation
0.5 per cent inter bank claims
0.4 per cent portfolio investment flows
The note goes on to argue that most people tend to react on the basis of the things appearing at the top of the above list, when in fact markets are concerned more with the things appearing at the bottom of the list.
Abnormal Returns is the norm and not the exception
The table below gives the calendar year Nifty returns for the last 10 years
| YEAR | % |
| 2004 | 10.68 |
| 2005 | 36.34 |
| 2006 | 39.83 |
| 2007 | 54.77 |
| 2008 | -51.79 |
| 2009 | 75.76 |
| 2010 | 17.95 |
| 2011 | -24.62 |
| 2012 | 27.70 |
| 2013 | 6.76 |
A look at the Nifty returns in the last 10 years gives a very interesting analysis. It shows clearly that double-digit returns are the norm and not the exception. In the calendar year 2013 the Nifty gave single digit returns. In all the other years the returns are in double digits. In fact, there are only two years of negative returns. In the other years returns are abnormally high. On an average once in every five years the market is up by more than 50 %. Over the period of the last ten years the market has given positive returns in 8 years. Hence, the odds of being a successful investor when you are ‘sitting on cash’ rather than ‘sitting on stocks’ is just 20 %.
Market Capitalisation v/s GDP ratio
I have written about this before. The ratio at the close on Friday, 01 August, 2014 is shown below and the comparison with the last market top is also visible. (All amounts are in Rs. crores)
DATE |
NIFTY |
GDP |
MKT CAP |
RATIO |
08-Jan-08 |
6357 |
4582086 |
6543272 |
1.43 |
01-Aug-14 |
7603 |
10472807 |
8720183 |
0.83 |
As I have written earlier, a ratio above 1 is considered as over valuation. In any case we are far below the 2008 figure.
Important Ratios
There are three other ratios which are popularly followed and tracked for deciding market valuations, these are Price to Book Value, Price to Earnings and the Dividend Yield. The ratios and dates are as follows:
| DATE | P/E | P/B | YIELD |
| 08 Jan 2008 | 28.29 | 6.55 | 0.82 |
| 01 Aug 2014 | 20.05 | 3.42 | 1.32 |
In terms of valuation we are far lower than the stretched valuations at the top of the last bull market. These are all historical figures and have no predictive power. Also market direction and trend is more important than valuation metrics. In bull markets, valuations are generally stretched and tend to remain stretched. In bear markets, valuations may be compelling but the market may continue to languish.
Conclusion
It does not matter, that the market is higher than it was in January. What matters is where it is going or where it will be in the future. The past does not matter. The real estate market is also near all time highs and so is gold. In fact both these asset classes have more or less stagnated for the last 12 months. The market is unlikely to turn south on a dime. Stocks are still the best option for the retail investor.
[jetpack_subscription_form]
Question 1 Can 200 day DMA used for short term outlook ?
Question 2 In the above graphs when ever there is a big gap between 200 day DMA and market the trend has reversed can there be any critical indicator based on the difference between the two to determine that it is likely to tank or vice-versa.
1. Investment is stocks ideally is a long term call, so it can be used but it is a timing tool.
2. FII flows, don’t try and catch a falling knife and trend is your friend. Also remember that markets and the economy is cyclical so try and identify the cycles and play them.