(Cartoonist: Dave Carpenter: Cartoonstock.com)
Very long ago, some one taught me that ‘well begun was half done’. As far as markets are concerned, can the first trading day, week, or month be used as an indicator, for the remainder of the year’s stock market performance? Market participants are known to be superstitious. Just like ‘Sell in May and Go away’, there is another stock market parable which says ‘As goes January so goes the year’. This is popularly called ‘The January Effect’ or ‘The January Indicator’ or ‘The January barometer’.
Is there a January Effect or is it a Non-Effect?
The January effect was first introduced by Yale Hirsch in 1972. Yale Hirsch is the author of Stock Traders Almanac and is credited with being an authority on stock market cycles. He is credited with discovering important stock market phenomenon like ‘Santa Claus rally’ and ‘Sell in May’. I personally am not fond of any of these. However, my curiosity does tend to get the better of me, whenever I read or hear of any such phenomenon. This is the rationale behind the ‘January effect’:
-
If the month of January is up, as compared to where it was at the beginning, then we generally have an up year. Conversely, if the market is lower in the month of January, then the rest of the year will follow.
-
It seems the January effect works better if we consider three dates viz the 1st trading day of the month of January, the fifth trading day of January and the last trading day of January.
A lot of research has been done on the January effect. I took a look back, to see what we can learn from how the market started out in each of the last 20 years, compared to how it ended the year. The data for the Indian Stock Market is as follows:
1. In the last 20 calendar years we have had only seven down years and thirteen up years.
2. In case one considers only the up years, then the indicator works only in seven of the thirteen up years. In other words, a probability of roughly 53 percent.
3. In case one considers only the down years, then the indicator works only in four of the seven down years. Again a probability of roughly 57 percent.
4. It seems it does work 50 per cent of the time, which is as good a result as one would obtain, by tossing a coin. In effect, not as great or predictive as the publicity the January effect generates.
5. However, I don’t think one should write off the January effect just as yet. What if we filter the results by requiring both a positive return during the first five trading days of January, and a positive return in January, for a positive signal? Conversely, we require a negative return during the first five trading days of January, and a negative return for January, to generate a negative signal. ( The results are shown below. Instead of first five days I have used the first week since that will cover five trading days).
- Please observe the percentage returns in each of the scenarios. They tell their own story. When the first week and the month of January both have positive returns, then the signal is predictive 86 percent of the time for a positive year.
- Also observe the last column showing ‘average returns’ in the different scenarios. These vary significantly in each of the six scenarios.
- Even more interesting is the fact that when there is a negative prediction in January, still the year-end returns are positive. This is because historically markets are known to be up, more often, than they are down. It does make sense to be eternally bullish!!
| # of Year Occurred | # of Positive Years | Success Percentage | Average Positive Year Return (%) | |
| A POSITIVE JANUARY | 8 | 7 | 87.50 | 24.43 |
| POSITIVE 1ST WEEK OF JANUARY | 11 | 8 | 72.73 | 8.71 |
| BOTH POSITIVE FOR THE WEEK & MONTH OF JANUARY | 7 | 6 | 85.71 | 20.32 |
| # of Year Occurred | # of Positive Years | Success Percentage | Average Positive Year Return (%) | |
| A NEGATIVE JANUARY | 12 | 6 | 50.00 | 7.94 |
| NEGATIVE 1ST WEEK OF JANUARY | 9 | 4 | 44.44 | 21.65 |
| BOTH NEGATIVE FOR THE WEEK & MONTH OF JANUARY | 8 | 4 | 50.00 | 17.71 |
6. Perhaps the January effect works better in predicting bull markets than in bear markets. This three-minute video says it better than words:
Predictions – the consensus in January 2015
According to the Chinese Zodiac 2015 is the year of the goat. For market participants however, it will in all probability turn out to be the year when everyone converts into a liquidity bull. So 2015 should continue in the same trend as 2014, as long as global central banks keep the money spigot firmly switched on. There is little by way of analysis or research that can disprove this. Will the joint actions of all the worlds central banks be successful in kick starting global growth? The answer and its relevance, is lost on most of us. It is something which is just besides the point. We are all now liquidity bulls, and bracing for more of the same. We are counting on continued central bank largesse in 2015. Whether it comes in the form of an interest rate cut in India, or further global easing, how does it matter? The outcome? Your guess is a good as mine! The consensus trades for 2015 are:
-
Have a look at the dollar index below:
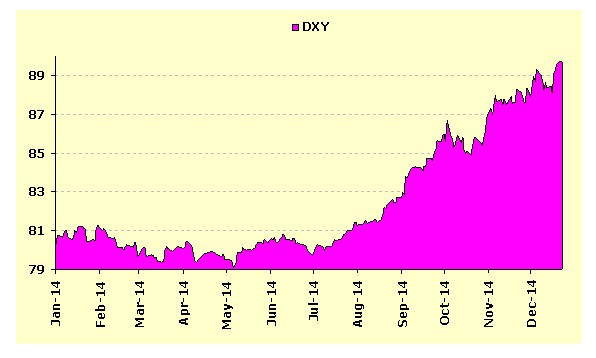
(Courtesy: Mecklai Financial Services Ltd)
-
There is unanimity among all economists and analysts that dollar index (DXY) will continue to rally in 2015. The U.S. dollar as a currency, it seems, is the ‘cleanest among the dirty shirts’. I like the wording, and the way some of these guys express their opinion. It basically means that all currencies are looking bad, but among them, the U S dollar is the best. Incidentally, the dollar index (DXY) closed at 91.12 on Friday, 02 January, 2015. This is above the so-called resistance level of 90.50.
- The second consensus among analysts and economists is that with interest rates in the United States set to go higher, the Emerging Market (EM) economies will be adversely affected. However, in the EM sector, it seems, India is the ‘cleanest of the dirty shirts’. The Indian stock market is widely expected to out perform all other emerging markets.
- In 2014 the correlation between global markets broke down. This means that till 2014, different asset classes and geographies mostly moved in unison. This breakdown of correlations in 2014 is expected to increase in 2015. This is attributed to the fact that different central banks are moving in different directions.
Consensus in January 2014 v/s Facts
- In January 2014 the consensus was that the Chinese economy was finished, hard landing – whatever that means. In any case, 2014 ended with the Chinese stock market out performing all other markets, including India. What about the Chinese economy? Nobody knows anything with any degree of certainty.
- The other consensus in January 2014 was on the U S bond yields. They were supposed to go up. They went in the reverse direction. The U S bond market yielded close to 27 % for the year, compared to the Standard & Poor (S&P) benchmark returns of 12 %.
- Nobody saw the oil crash, and nobody saw the dollar strength. When the market corrected in October, there were doomsday predictions galore. All were wrong. The problem with financial forecasting is that no probabilities or weight-ages are attached to them. If they were, we would get an idea of how to rate them, and then act on them. Unfortunately, much as we may try, we tend not to ignore predictions. We start aligning with those that are reassuring to us.
Dogs of 2015
In one of my earlier posts I had written about a ‘Dogs Strategy’ for stock selection. Click here to read that post. This is another old theory which has been ridiculed lately. It may surprise many, that the ‘dogs strategy’ beat the Nifty in the year 2014. In case you wish to use the ‘Dogs strategy’, please read the post first. It is a strategy to be implemented at the beginning of the year. I must concede, that I had written about it in July 2014. I did an analysis of the returns obtained by investing on 01st January,2014 and when the post was published. You can download the same and a list of the ‘Dogs of 2015’ by clicking here : DOGS OF 2015
( A word about automated investment strategies, since I have been writing about them. There are plenty of strategies. The secret is to follow them as they are and not to interfere. This, unfortunately, is easier said than done. One thing is certain, don’t expect the market to forgive you, if you make your own modifications, while implementing any such automated investment strategy!! Finding a strategy is easy – sticking to one is the challenge.)
What to do
I feel the following will be relevant for the year 2015:
-
In markets, indicators such as the ‘January effect’, generally work until they become widely known. Once they are heavily publicized they tend not to work, as they have in the past. This is true of the ‘January effect’ as well. Since it hasn’t worked of late, it is being ignored. Hence, there is a high chance of it working in 2015.
-
The father of value investing, Benjamin Graham, has said: ‘In the short run, the market is like a voting machine – tallying up which firms are popular and unpopular. But in the long run, the market is like a weighing machine – assessing the substance of a company’. The message is clear: What matters in the long run is a company’s actual underlying business performance and not the investing public’s fickle opinion about its prospects in the short run. Wherever this January ends, the key is to look forward!!
Looks like January 2015 is going to end up higher as compared to Dec 2014.
Hope the market follows suit throughout the year.
Shailesh
Still early days. Wait till the end of the month!!