(Cartoonist: Doug Pike; cartoonstock.com)(Friday, 3 June 2016)
India’ GDP under the new series has been a hotly debated topic. Most people feel that the ‘growth on the ground’ is weak, and not robust as the numbers suggest.
India’ GDP; How to Read the Numbers?
GDP or Gross Domestic Product is defined as the monetary value of all finished goods and services produced within a country’s borders in a given period. In other words, GDP measures the nation’s economic activity. In 2015 the Indian Central Statistical Organisation revised the methodology for computation of GDP. As a result, we now have reference to the new GDP series and the old GDP series. Almost all economists and market participants view the new GDP series with suspicion.
Economic growth, as measured by the GDP data is what matters to the-the stock market. The potential growth rate is what is relevant. The rate at which the Indian economy grows has a direct effect on the performance of India’s corporate sector. All in all, a higher GDP growth rate augurs well for investors. To arrive at an investment thesis, we are concerned with two things; (a) the potential rate of growth of India’s GDP and (b) the valuations of Indian equities.
The potential Rate of Growth of India’s GDP
The Reserve Bank of India has published a report dated 21 April 2016 titled India’s Potential Output Revisited written by Barendra Kumar Bhoi and Harendra Kumar Behera. The stated objective of the report is:
“In February 2015, the Reserve Bank of India and the Government of India have agreed to an institutional architecture that empowers RBI to pursue price stability as the primary objective of monetary policy. To achieve price stability, it has become all the more important to understand whether there is any excess demand or excess supply in the economy. In this context, a correct assessment of output gap is crucial to monitor the inflationary pressures in the economy.”
The words ‘output gap’ are defined as ‘the percentage deviation of actual output from its potential level’. In layman terms, they have tried to determine the actual growth rate of the Indian economy for the period 2009-2015. The conclusions arrived at in the report are as follows:
-
India’s potential growth rate was 6.7 percent at the end of last year, down from 7.2% on average between 2009 and 2015 and from 7.6 percent in the five years before that.
-
The potential growth rate is the rate at which the economy can be safely assumed to grow in the future, without any inflationary repercussions.
- It seems that the potential growth rate has fallen because productivity has dipped and corporate India has failed to invest in the infrastructure necessary for improving growth.
In other words, what they suggest is that growth expectations need to be tempered with a downward bias. The guys at India’s Ministry of Finance think that the current growth rate is faster than the projected rate. They see the potential rate of growth reaching ten percent. The difference is gargantuan. I am tempted to go with the figures as estimated by the Reserve Bank of India (RBI). The reason is that the RBI is known for its independence. To be fair, the RBI report also contains the following: (which I think is a disclaimer of sorts)
“The precise estimates of potential output are difficult to produce and considerable uncertainty is attached to these estimates, mainly related to the methodology, underlying data and judgements about different parameters. However, the uncertainty surrounding the estimates is difficult to measure. An attempt is made in this paper to estimate these uncertainties using Kalman filter.”
The fact that GDP calculations are an exercise in estimation is a given. Purely from an investing perspective, anything above 7 percent is ‘good to go’. In the end, everything is cyclical, peaks and troughs in GDP growth rates are part of the cycle.
Valuation of Indian Equities
Warren Buffett in an interview given to Fortune Magazine in 2001 commented that the ratio of a country’s GDP to the Market Capitalisation of its stock market was ‘probably the best single measure of where valuations stand at any given moment’. This metric is popularly called the Buffett indicator or the Buffett ratio. The logic is something like this; Under idyllic conditions, the total market capitalisation of a country’s stock market should not exceed its GDP. However, reality is a bit nuanced. Most of the time stock market valuations tend to be all over the place (especially in the short-term), without any regard for GDP. Can this be used as a stock timing tool? I think it can, but only from a long-term perspective. Where do we stand as measured by this metric?
As per data available on the website of the Reserve Bank of India (RBI), India’s GDP (at Market Prices) under the new GDP series, is stated at Rs. 12541208 crores for the year 2014-15. As against this, the total market capitalisation of stocks listed on the NSE as on 03 June 2016 was Rs. 9806396 crores. That works out to a GDP to Market Cap ratio of 78.19 percent. What does one make of that? I look at it like this:
- Relative valuations; how does the valuation of Indian equities compare with those of other Emerging Market (EM) economies? Currently, Indian equities are quoting at a premium as compared to other EM’s. However, it has always been thus, not alarming. That does not mean that Indian equities are cheap, they are not.
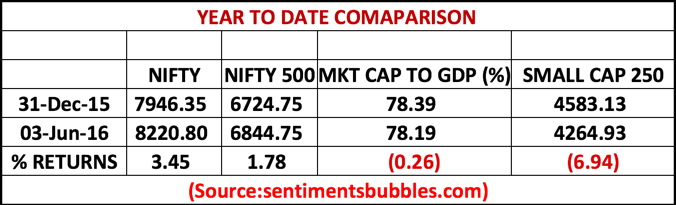
- As regards the market capitalisation to GDP ratio, we are more or less where we started the year. From the year to date comparison shown below, it is apparent that the Small Cap 250 Index is trailing the benchmark indices. Maybe, it’s time that the rally becomes a bit more broad-based.
Where are markets headed?
Instead of ‘sell in May and go away’ we had ‘will Rajan go away’ as the theme in the May 2016. I suppose the expression ‘If it ain’t broke, don’t fix it’ aptly describes whether or not Raghuram Rajan should get an extension. Unfortunately, that is not how the ‘system’ works. The Indian Rupee seemed to wilt as rumour mongering about ‘will Rajan go away’ reached a crescendo. What does one make of it? Pimco says India Growth to Lure Investors as Rajan fate in Limbo talks of the effect on India’s debt market. What about Indian equities? Will Indian equities continue to get premium valuation is such a scenario? Only time will tell.
Markets are poised for an event packed international calendar in June. The U.S. Federal Reserve is slated to meet on June 14/15. The meeting will end with the customary policy announcement made by Fed Chair Janet Yellen. Until the year 2014, the perception was that the U.S. Federal Reserve was concerned with U.S. monetary policy alone and nothing else. How things have changed! Now, Janet Yellen is the Central Banker of the world as a whole, and the S&P 500 is the world’s ATM! As I see it, this debate over Fed rate hikes is set to continue in the foreseeable future. Indian markets are not immune to Fed policy announcements, and anxiety is here to stay. I found this tool and decided to have a bit of fun. You can build your wheel, click here to do that.
Fed Roulette Wheel
I liked the Fed Roulette wheel… 🙂
Shailesh
Thanks