(Cartoonist: Mike Shapiro: Cartoonstock.com)
Lies, damned lies and statistics is a quote by the 19th century British Prime Minister Benjamin Disraeli. It is used to signify that numbers have persuasive powers and that they are often used to bolster weak arguments.
GDP Statistics: De-jargoned
Practically every research report on a stock or the Indian economy refers to India’s GDP and its inflation. It is the basis for the bull run. Hence, the importance of the new GDP regime announced on January 30, 2015. This is what the different terms mean:
1. Base year: The base year is used as the reference point for measuring price changes. You can call it the denominator.
2. Valuation: GDP is the monetary value of all goods and services produced in a country. Factor cost is the cost of producing output and includes land labour and capital. Market price represents the cost of purchasing that output. Market prices include taxes and offsets subsidies. Market price GDP measures activity by adding up consumer spending. Factor cost GDP measures activity by adding up producers costs.
3. The nominal value of GDP is the figure arrived at before inflation. Real value of GDP is the nominal value adjusted for inflation. Hence, nominal GDP is always higher than real GDP.
How to lie with statistics
I read a small book called How to Lie with Statistics written by Darrell Huff. Among other things, the book advises readers to ask five questions about any statistical data. I have borrowed the questions from the book and tried to make sense of the GDP numbers.
Question no 1: Who says so?
In this case, the statistics are reported by he Ministry of Statistics & Programme Implementation, Government of India. They have issued a ten page FAQ on the changes. Click here to read the FAQ. All statistical data emanates from a sample. All results that emanate from a sample have a bias. Many times the answers given to questions in a sample are influenced by the desire to give a pleasing response. These and countless other human preferences make the results of most samples worthless. The kind of people who are used to ask the questions also affect the results. They have their set of biases. Hence, surveys and polls do not have to be rigged by anyone. Any such study has an inherent bias, no effort required!!
Question no 2: How does he know?
The methodology used by the ministry according to its site is as follows:
The Ministry of Statistics and Programme Implementation attaches considerable importance to the coverage and quality aspects of statistics released in the country. The statistics released are based on administrative sources, surveys and censuses conducted by the Centre and State Governments and non-official sources and studies. The surveys conducted by the Ministry are based on scientific sampling methods. Field data are collected through dedicated field staff. In line with the emphasis on the quality of statistics released by the Ministry, the methodological issues concerning the compilation of national accounts are overseen Committees like Advisory Committee on National Accounts, Standing Committee on Industrial Statistics, Technical Advisory Committee on Price Indices. The Ministry compiles data sets based on current data, after applying standard statistical techniques and extensive scrutiny and supervision.
I think this is the crux. It says that they rely on central and state government surveys and censuses. Also, the methods are scientific. The following are the likely fallacies and biases:
1. Most of the statistics that you see and read is on sample selection. For, e.g.,. Nobody is counting all the industries that exist. There is a sampling procedure that is inherent to every statistical report. The sample size as a percentage of the underlying data will decide whether or not the sample reflects a correct picture. The smaller the sample the lesser is its accuracy.
2. The methodology clearly states that they rely on ‘non-official sources and studies’. I wonder what this means? Looking at the size of India’s parallel economy, the accuracy of the data is a bit doubtful.
3. In samples, the trick is asking the questions. In the broking business, we have to ask all our clients their income. The modern practise is to give a range and ask them to check the appropriate box. If I ask you your income with a range, you are automatically lying. In all such cases, answers will differ depending on about what the survey is. If it is about increasing taxes, the answer will be different. If it is about a study of wealthy people in your area, your answer will change.
Question no 3: What’s Missing?
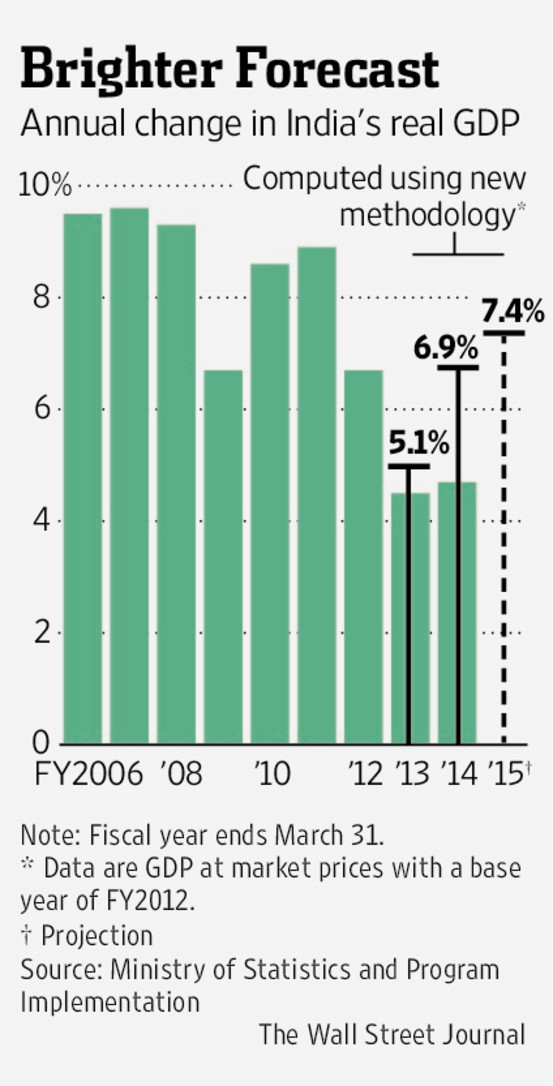
Some things remain common between the two sets of data. The economy is accelerating. The size of the economy remains the same, so it should not affect the targeted fiscal deficit in absolute terms. Have a look at the image below:
Question no 4: Did someone change the subject?
The official release says that conceptual changes, as recommended by the international guidelines, are incorporated in the new GDP estimates. Apart from these there are four changes. These are as follows:
-
Since 2010, the base year was the financial year ending on 31st March, 2005. Now the base year has been changed to the financial year ending on 31st March 2012. This change is not expected to affect the nominal value of the GDP. However, the basis of comparison has been modified.
- The valuation of the Gross Domestic Product, (GDP) is now being done at market prices. It was being done at factor cost prices earlier.
-
The third change is that coverage has expanded to include manufacturing, services and sectors not previously represented in the GDP estimate. It is expected to increase the value of India’s GDP since previously uncovered segments are included. The 10 page FAQ referred to above says ‘a better measurement of manufacturing activity has been made possible by a new database of corporate balance sheets.’
-
Under the new regime, the weight-ages of different sectors in India’s GDP has changed. Manufacturing now has an 18 percent share (previously 15 percent), real estate, hotels and financial and business services have a 51 percent share (60 percent earlier) and agriculture has a 17 percent share (against 14 percent). The FAQ says that in the past GDP calculation, activity by small retailers and wholesalers was overstated.
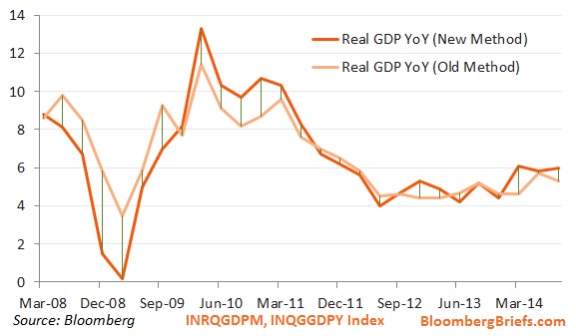
The image below shows the impact:
Question no 5: Does it make sense?
The answer in one word is: No. The reasons:
- Now different indicators of economic activity are pointing in different directions. So the IIP numbers and GDP numbers are effectively not comparable. The Index of Industrial Production (IIP) shows manufacturing activity slowing down, whereas the new GDP figures show a jump in the same.
- The ministry has admitted that the past GDP calculations were flawed. How can one trust the new numbers? Moreover, the time lag for publishing GDP statistics in the Indian scenario is much more than the international standard.
- The optimism in the numbers is not reflected in the third quarter results. If you ask any businessman or industrialist about the economic scenario he tends to project the outlook as gloomy. In other words, at ‘ground zero’ these numbers seem to be all hogwash.
The Conference Board Statistics
1. We are now in the unique situation wherein nobody knows what our GDP is. Most of the media are obsessed with Greece and Ukraine, I think we should be paying more attention to the GDP instead.
2. What I did was to see what the Conference Board was saying about the Indian economy. I have written about the Conference Board before; you can read that post here. In its latest press release issued on February 18, 2015 it says:
Despite the small gain in the Leading Economic Index for India in January, the slower rate of six-month change in both the LEI and CEI for India suggests that the economy is off to a slow start in the new financial year,” said Jing Sima, Senior Economist at The Conference Board. “While low oil prices, favorable terms of trade, and the recent monetary easing will provide some lift to India’s economy, persistent weaknesses in both domestic and external demand suggest growth is unlikely to substantially improve this year.
You can read the full report here.
3. I have been reading of it being ‘darkest before dawn’ (with emphasis on the Indian economy) for over two years now. It does seem to be a very long night with a prolonged dawn!!
Studious article! Keep it up!!
I am of the view that people are currently finding reasons to support their optimism in the market. GDP is one of those parameters. Why GDP? There are actually many concepts (like inflation, deflation, recession, currency fluctuation/ peg) people still are unclear and bet on! Many people active in future & options don’t know these are the financial instruments of hedging!
It seems Modi government has successfully demonstrated favorable investment environment to try for India. Finance budget may be the next track changing event people are looking at!
I certainly hope that the optimism is reflected in the Union Budget. It is true that the latest GDP statistics are being used as a justification. I certainly hope it does not turn out to be pyrrhic justification.
Well researched article!
Thanks, Shailesh.