(Source: www.shutterstock.com/cartoonresource)
The 200-day Simple Moving Average (SMA) of the Nifty is 8382. Currently, the Nifty is trading below its 200-day SMA.
What is the 200-day SMA
The 200-day Simple Moving Average (SMA) of the Nifty is the average of the closing prices of the Nifty for the previous 200 days. Very simply, the formula is [(day1)+(day2)+….(day200)] / 200. With each passing day, the oldest days data gets deleted and the latest days data gets added. Hence, it’s called ‘moving’ average.
Why is the 200-day SMA important?
The Nifty closed at 8189.70 on Friday, 09 October 2015. The Nifty broke below its 200-day SMA on 24 April 2015, after trading above this level for 382 trading days. Come to think of it, 382 trading days is longer than the average holding period of most investors! Hence, it is important. In any case, it doesn’t hurt to keep an eye on where the Nifty is trading vis-a-vis its 200-day SMA. The reasons are:
- ‘Trend is your friend’ in the investing game. How does one identify a trend? One of the methods is to look at the 200-day SMA of closing prices of the Nifty.
-
Markets trading below their 200-day SMA, are considered to be in bear phases and vice-versa. A lot of ‘smart money’ does use the 200-day SMA to arrive at ‘macro’ investing decisions.
How to ‘read’ the 200-day SMA?
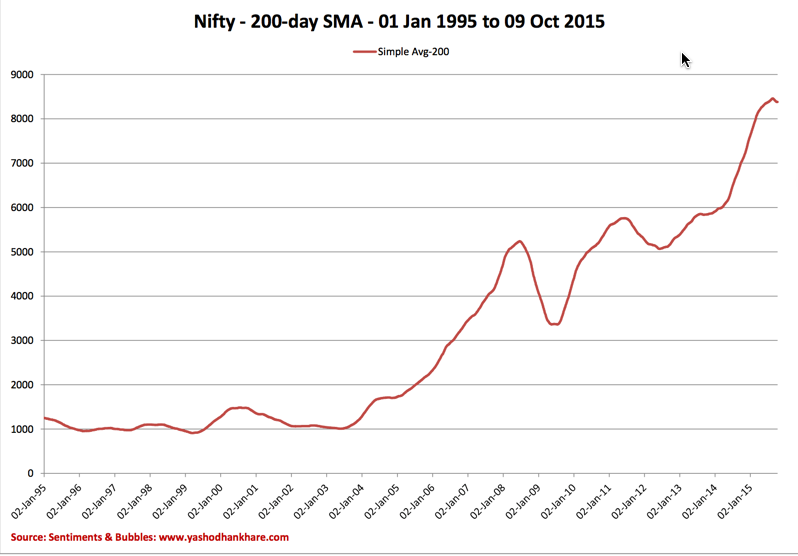
We often hear that the Nifty has broken its 200-day SMA, either on the way up or on the way down. Just saying that the Nifty has crossed over or under its 200-day SMA means nothing from an investment perspective. The slope of the 200-day SMA is relevant. Whether or not the market is, in fact, trading below or above the 200-day SMA is secondary. To find out how the slope looks, I plotted the 200-day SMA of the Nifty from the year 1995 till date. It looks something like this:
(Click on the image to embiggen)
If the 200-day SMA is sloping upwards, it means that the long-term trend is bullish. In other words, the curve or the average has to be pointing higher. A rising average in a bull market would mean that the long-term trend is intact. With this in mind, the following conclusions can be drawn from the image above:
1. The graph for the period up to April 2003 is pretty flattish. It is neither upward sloping nor is it downward sloping.
2. From April 2003 onwards, the upward slope of the 200-day SMA is very pronounced. The change in trend during the calendar year 2008 is visible. Post-2008 and till date, the 200-day SMA is again upward sloping. Hence, the long-term trend doesn’t seem to be threatened in any way. However, this is of no use to us. We are all interested in the short-term trend.
3. In other words, the slope of the 200-day SMA defines the historical trend. However, it doesn’t tell you whether we are poised to move up or down in the short-term. It may be able to give you hints. In the end, you are going to make a calculated guess.
4. How does one make a calculated guess of the short-term trend by looking at the 200-day SMA of the Nifty? What I have done is as follows:
- It is easy to conclude that the direction of the Nifty will be influenced by the direction of its composite stocks. It follows that the percentage of Nifty stocks trading above their respective 200-day SMA will help to arrive at a conclusion as to the direction of the benchmark.
- When the percentage of Nifty stocks that are trading above their 200-day SMA changes, it would signify there has been a change in market momentum from bearish to bullish or vice versa, as the case may be.
- The Nifty comprises of fifty stocks. Each of these has their independent 200-day SMA’s. There will be a finite number of Nifty stocks that are trading above or below their 200-day SMA’s at any given point in time.
- I calculated the number of Nifty stocks that are trading above their 200-day SMA’s for all trading days from 01 January 2013 till date. In this way, I arrived at a percentage of the number of ‘issues’ that were trading above their 200-day SMA on each day from 01 January 2013.
-
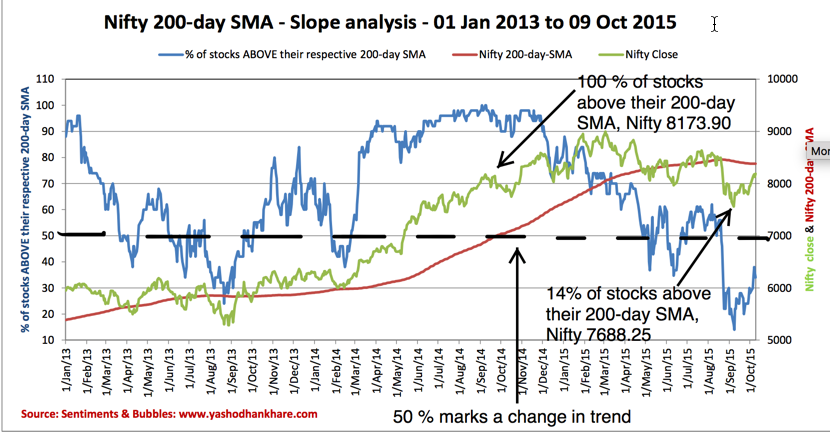
I then plotted this data and juxtaposed this image with that of the Nifty, and it’s 200-day SMA. It looks something like this:
(Click on the image to embiggen)
There is a slew of statistical information that this analysis throws out. We are only interested in trying to arrive at a calculated guess regarding the short-term trend. With this mind the following points are relevant:
- The percentage of Nifty stocks trading above their respective 200-day SMA would tell us the ‘breadth’ of the market at any given point. Breadth can be defined as the degree of participation. Breadth shows the underlying strength of the Nifty. In other words, the higher the percentage, the better is the breadth and the stronger the ensuing rally. Needless to say, this would work both ways, up and down.
-
On 08 September 2014, 100 percent of Nifty stocks were trading above their respective 200-day SMA. This percentage has been consistently falling since then. The Nifty made its closing high on 03 March 2015 at 8996.25, almost six months later.
-
Coincidentally, exactly one year later, on 08 September 2015, only 14 percent of Nifty stocks were trading above their respective 200-day SMA. It also coincides with the intermediate bottom of 7558.80 on the Nifty on 07 September 2015. Since then, this percentage has been rising steadily.
-
Hence, the percentage of Nifty stocks trading above their respective 200-day SMA seems to be a ‘reasonable’ indicator of the short-term trend of the Nifty. It gives us a ‘ballpark’ estimate of the direction which the Nifty is likely to take. It is far easier to make a ‘calculated guess’ by looking at this statistic.
- To my mind, the 50 percent dashed line manually annotated in the image above is the ‘line in the sand’. The data shows that whenever more than fifty percent of Nifty stocks trade above or below their respective 200-day SMA a change in short-term trend is imminent. In other words, to signify a change in the short-term trend, two events have to coincide; (a) the percentage of Nifty stocks quoting above or below their respective 200-day SMA has to cross fifty percent and (b) the Nifty has to cross over or under its 200-day SMA. This would confirm a change in short-term trend.
- The Nifty closing of 8189.70 on Friday, 09 October 2015 is roughly 192 points shy of its 200-day SMA. As on 09 October 2015, thirty-six percent of Nifty stocks were trading above their 200-day SMA.
Caveats
All references to short-term in this post should be read as three months. Despite all the number crunching, trying to prognosticate trends beyond three months would be tantamount to financial hara-kiri. Clearly, the 200-day SMA is no ‘quick fix’ prediction tool. It is important to remember that:
- Moving averages of all types are called ‘lagging indicators’. They do not predict future price movements. They are used after the price action has taken place. Effectively, using quants (quantitative analysis) as a trading heuristic is not a foolproof method. Nothing is.
- When we look at the slope of the 200-day SMA, the reference point is critical. The larger the time span, the better. Changing the time frame can change the picture. That is why I have plotted the 200-day SMA from the year 1995 onwards.
- Every time the Nifty crosses it 200-day SMA, it cannot signify a change in the short-term trend. The number of days after which a cross over or under is occurring is relevant.
What to do?
With the Nifty still bobbing around tentatively close to its 200-day SMA, is it time for investors to take the bull by the horns? Market denizens have their eyes glued to an imminent bullish crossover of this grand-daddy of all moving averages. I wouldn’t be too excited about it unless the breadth indicator accompanies any such crossover. These thoughts might help:
- The 200-day SMA is used as a capital preservation and risk management technique. It can be used to book profits or initiate longs/shorts as the case may be.
-
The 200-day SMA helps an investor to define the underlying trend, nothing else. Once you recognise the trend, it would make sense to trade in the direction of the trend and not against it.
-
Emerging Markets (EM) as a sector have been in the eye of the storm in the current calendar year. It is the EM’s that have bought global risk appetite to its knees. Effectively, EM’s have negatively affected global investment sentiment. However, EM currencies have bounced back remarkably in the last two weeks. It is a positive sign. It does seem to suggest that the ‘mother of all sentiment squeezes’ is about to end.