(Cartoonist: Doug Pike; Cartoonstock.com)
For the layman investor, the most commonly used method of stock valuation is the Price to Earnings multiple or the PE ratio. The current market price divided by the latest earnings per share of the company in question gives us the PE multiple for the stock. From a historical perspective, the benchmark is currently trading at a high PE multiple.
PE ratios and Value Investing
The strategy of buying stocks based on low PE multiples forms the basis for value investing. Benjamin Graham was the original proponent of buying stocks trading at a low PE ratio. According to Graham, a PE ratio of 16 ‘is as high a price as can be paid for an investment purchase in common stock’. The implied meaning is that any ratio above 16 would be considered to be a risky bet. With the passage of time, even though the basic tenets of investing have remained the same, perceptions have evolved. Hence, saying that a PE ratio of 16 is expensive is passé. If one keeps waiting for the PE ratio to come below 16 or any such magical figure, one will end up waiting for most of the bull market to play out. Even Graham is known to have adapted and changed his style in his later years.
Are low PE ratios safe?
Is a stock quoting at a low PE ratio ‘safer’ than one quoting at a high PE? Not really. In real world investing a high PE ratio indicates an increase in confidence. This increase in confidence acts as a self-fulfilling prophecy, enabling bull markets to climb the proverbial ‘wall of worry’. As confidence increases, investors are willing to pay more for future earnings. Eventually, this results in PE’s expanding to unsustainable levels. The image below aptly illustrates this phenomenon:
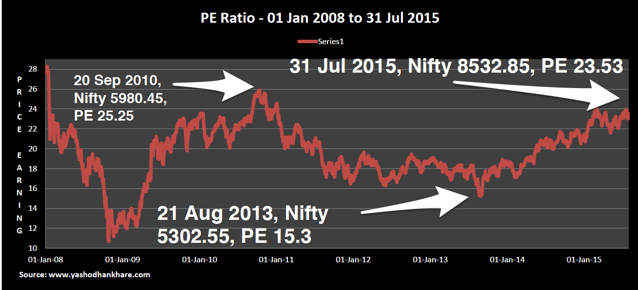
The PE ratio at which the CNX Nifty has traded from 2008 till date is shown above. The following conclusions can easily be drawn:
1. When markets are trading at a high PE ratio, the risk is lower. Why? From the image, it is pretty clear that when PE ratios are high, markets tend to go higher, not lower. The converse is also true. Since markets are counter-intuitive, markets trading at low PE multiples are, in fact, more dangerous than those trading at higher multiples.
2. Low PE ratios often give a distorted impression of the value in a stock. In the current scenario, there is an enormous temptation to buy stocks with low PE multiples. This may not always be the right thing to do. Just remember that the PE is low for a reason. There is obviously something that the market knows and we don’t. In such cases, it is prudent to give the market the benefit of the doubt.
3. From the image, it is clear that markets tend to trade above what Graham defined as expensive. In fact, 95 percent of the time the market seems to be trading in the expensive zone i.e. at PE multiples in excess of 16. By Graham’s metric, the benchmark has been overvalued ever since Aug 2013, that is 3200 Nifty points ago. Hence, Graham’s definition of what can be considered a safe market has got vitiated.
4. The prime reason that the PE ratio of 16 suggested by Graham has lost its relevance is that markets have expanded and so have company earnings and opportunities. Technological innovations have resulted in cost cutting and margin expansion. Hence, the levels of what can be considered to be an ‘acceptable’ or ‘safe’ PE ratio, has moved significantly upwards.
Can PE ratios predict stock market returns?
Is the PE ratio that we are currently trading at predictive of future returns? If we start the year at a low PE, does it translate into higher annual returns and vice versa? To find out, I ran an analysis of the PE ratio of the CNX Nifty at the beginning and end of each calendar year from 1999 till 2014. I then tried to see if there was any correlation between the trailing PE multiple and the year-end returns.
The four years with the lowest calendar year returns on the CNX Nifty from 1999 to 2014 are visible in the table below. The PE multiple at the beginning and end of each year is mentioned alongside. It is pretty clear that a low PE ratio at the start of the year does not translate into stellar returns for the year. Have a look:
| Year | PE Ratio | Yearly Returns | |
| 01-Jan | 31-Dec | % | |
| 2001 | 19.06 | 15.35 | 15.57 |
| 2002 | 15.29 | 14.83 | 3.62 |
| 2013 | 18.82 | 18.70 | 5.93 |
| 2004 | 21.09 | 15.32 | 8.80 |
The table below shows the calendar years where we started off with a high PE ratio. Here too, a high PE to start with, did not translate into low or negative annual returns on the benchmark.
| Year | PE Ratio | Yearly Returns | |
| 01-Jan | 31-Dec | % | |
| 2010 | 23.31 | 24.48 | 17.25 |
| 2007 | 21.48 | 27.62 | 53.18 |
For obvious reasons, the calendar year’s 2000 and 2008 have been ignored in the analysis shown above. The following conclusions can easily be drawn:
- There is no correlation between PE ratios at the beginning or end of a calendar year and the returns for that year. Even when markets have begun trading at a high PE ratio, this has not been automatically followed by negative returns in the ensuing year.
- Stock prices and earnings don’t move concurrently. Prices tend to move ahead of earnings and fall before a drop in earnings. So PE ratios tend to rise well in advance of earnings and fall before them.
-
PE ratios are poor at predicting stock market returns. Just as past performance cannot predict future returns, PE ratios in isolation, predict nothing. Price to Earnings was one of the four parameters that Graham had suggested (the other three are: debt-to-equity ratio, price-to-book value and market capitalisation). To look at PE ratios in isolation, would be doing injustice to the principles laid down by him.
PE compression in sideways markets
Currently, the market is devoid of a trend. Hence, we are witnessing PE compression. Stocks quoting at fancy PE multiples getting crushed is par for the course in sideways markets. In sideways markets, they say that the ‘payback’s a bitch’, meaning it is time for markets to get even. Effectively the market is getting even and setting right the abnormal PE multiple. PE compression would mean:
- Stocks which are quoting at a very high PE would deliver lukewarm or negative returns. The so-called growth stocks tend to get hit the hardest.
-
Earnings growth and the price to earning multiple, work in opposite directions, resulting in PE compression. This is illustrated in the image below:
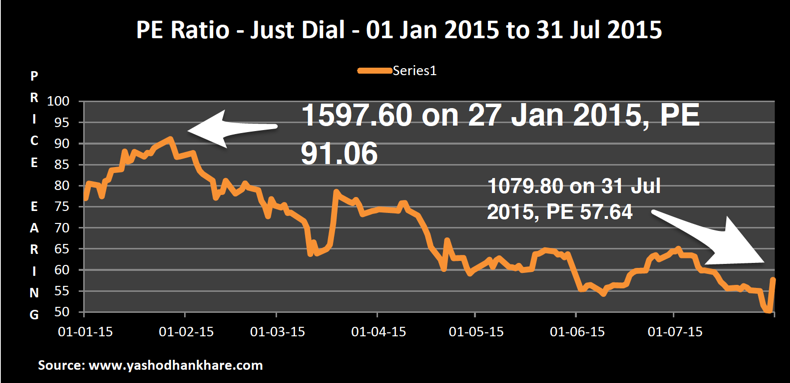
The image shows the PE multiple for JUSTDIAL from 01 Jan 2015 till date. JUSTDIAL is perceived and categorised as a growth stock. Hence, it has always commanded a fancy PE multiple. In the current year, there have been no ‘negative surprises’ in the company’s earnings announcements. However, as expectations of earnings growth haven’t yet come to fruition, the PE multiple is getting crushed. The PE multiple for JUSTDIAL is still way above what can be considered ‘safe’. In spite of PE compression, you will find that growth stocks tend to stay expensive in bull markets. This is common. (I am not recommending that JUSTDIAL should be bought or sold. I have used it to illustrate PE compression, nothing else. I have no positions in JUSTDIAL, short or long).
Have PE ratios reached a ‘permanently high plateau’?
All of this does not mean that stocks are cheap at current valuations. The words ‘high’, ‘low’, ‘cheap’ and ‘expensive’ are very relative, as is everything else in the stock market. As investors what we have to guard against is getting caught in the extremes, like buying in extremely overvaluation and selling in extreme undervaluation. As a student of the markets, I can safely hazard to say that:
-
The moment when most investors start ignoring the PE ratio and start justifying it is the time when markets enter bubble territory. This is what happened in the calendar year’s 2000 and 2008. Currently, we are witnessing ‘PE justification’ in the e-commerce space all over the world. Fortunately, for us in India, most of the e-commerce companies are not listed.
- If you start looking at historical data, you will realise that markets are seldom normal. The market is too random and dynamic to be priced in a manner that most commentators will find to be perfect. We should consider it normal for markets to be priced in a way that is abnormal; alternatively over priced and under priced, but never perfectly priced. Even when there is unanimity that markets are priced for perfection, they seldom stay that way.
-
The CNX Nifty is currently trading at a PE multiple of around 23. The long-term average for the Indian stock market is around 19. Recently, when the Nifty dipped below 8000, the PE multiple was 22. There is no such thing as the ‘ideal’ PE multiple, worthy of investment. At any given point in time, you will always have people screaming that markets are under/overvalued. Investors will do well to ignore all such prognostications, with extreme bias. In my opinion, investors waiting for the ‘Lehman moment’ to take investment decisions are Waiting for Godot.
Appreciate your article and initiating discussion on P/E ratio. I like this particular ratio because it takes into account Market Price which runs on futuristic assumptions and Earning which is used to carry historical background. PEG may be still a better ratio though I feel it is more subjective and carry assumption error. I have a few questions on which you may elucidate for better understanding to the readers –
1. Shall one consider buying a stock like Dish TV which has P/E around 109, on the basis of the fact that it will be on the growth trajectory ?
2. What an investor should do for the stocks like Suzlon Energy, which has negative P/E, since for last many years? Or in such cases P/E shall be ignored.
3. Why some of the companies like Eicher Motors, Page Industries (P/E 78), Thomos Cook (P/E 191) have erratic P/Es and whether an investor shall still purchase/ accumulate such stocks, assuming he is bullish on those stocks?
After all ratios are just the indicators. If we want to do a friendship, we need to understand the person from our heart, not from the mere appearance!
As I have said, it is incorrect to evaluate a stock on PE ratio alone. I have written about historical PE; the market works on forward PE. Stocks cited by you are all trading on the basis of future earnings. So if earnings don’t live up to expectations, they will correct. In short, one will have to evaluate on a case by case basis. I am not aware of the earnings reported by Eicher etc, buy t.he fact that the price seems to be on a upward trajectory does suggest that they are living up to expectations. At what point or what PE you would want to invest is a personal choice. Someone may not want to buy a PE of 50 or some such number. The point is that PE alone cannot decide an investment decision and that a high PE is not necessarily predictive of anything apart from growth expectations.
If clients ask for p/e ratios, what are their decisions for a higher P/E stocks ?
Considering that ,generally common investors have wrong ideas, then do these high P/E stock results into super returns ?
My point is, the high P/E s have to be researched in the light of ownership. For example, in the initial period of the info boom & may be till 2008-09, all info stocks were quoting at p/e in the range of 30-40, as common investors were not taking bets on this sector. As they started perceiving these stocks as safe bets & started owning them, the P/E has fallen to 18-25 levels.
True. The first thing is that PE of a stock and that of the index will differ. However, the rules of the game will remain the same. In case of IT, stocks pointed out by you if it were INFY people made money buying at the top in 2000 as compared to the price today. However, this is not true of all IT stocks. To come to the point, a retail investor will be safe buying a high PE stock depending on the stock he is buying. If he had bought the index at the top in 2000 or 2008, he would be a winner today. True. I think your point is well taken with respect to IT stocks. For other sectors too it will work, but then we are getting stock specific. Hence, the analysis will differ by stock and sector is understood. To summarise in a rising PE environment, a retail investor might be best placed to buy an index fund.
There is one more ratio called PEG. Ratio of growth in profits to PE. If profit growth is higher than PE multiple then PE is justified. If Just dial profit growth is 70% and PE is 60 then it is ok. If HUL profit growth is 20% & PE of 40 is not ok.
Good point, but PEG ratio ‘s are hard to compute since the earnings growth that is going to occur in the future cannot be accurately predicted. I wouldn’t compare HUL and JD – different sectors. One is an MNC with years of positive growth and dividend history. JD is relatively new.