(Source: www.shutterstock.com/cartoonresource)
Every time there is a correction, all of us are scared. Are stock market corrections irrational? Not always. How can a layman investor ‘trade a correction’?
Historical Correction Analysis
In the current year, the ‘peak to trough’ correction was roughly sixteen percent. (I am making a dangerous assumption, which is that the current correction is done with!). How does that compare with past corrections? To find out, I collated the historical ‘corrections timeline’ for the calendar years from 2004 till date. Take a look:
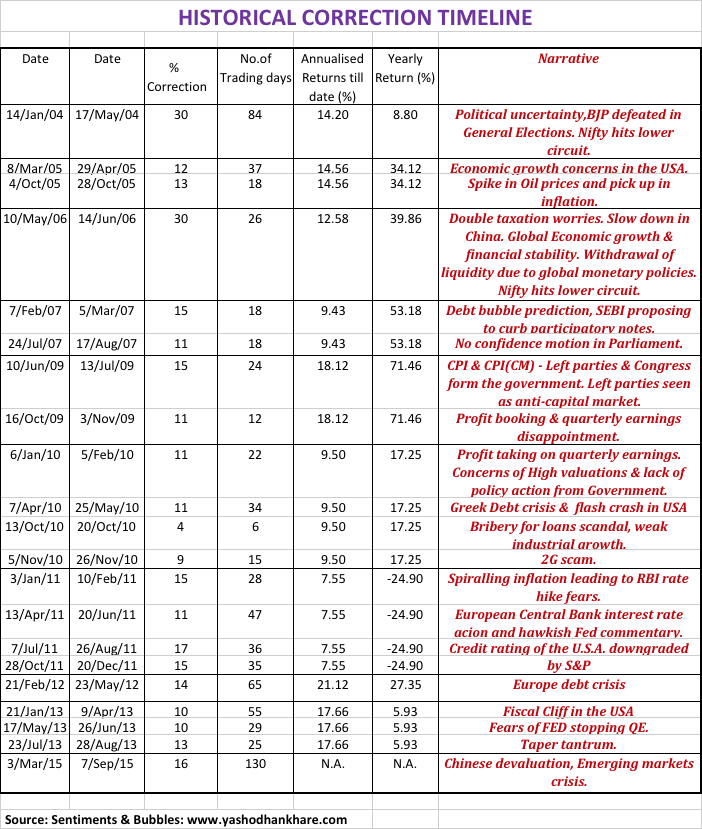
In the year 2008 we had a crash, not a correction. Hence, in the analysis presented above, I have excluded the calendar year 2008. I have considered corrections that are more than ten percent, in a calendar year. Whether this ten percent correction has occurred ‘on the trot’ or it is a culmination of more than one period within a year has been ignored by me for the purposes of this exercise. The idea is to try to get a ‘handle’ on the reasons for former corrections and to see if any lessons can be learnt. This is what I learnt from the table above:
-
Every correction is paraphrased with nice sounding abbreviations. So we have, Fiscal Cliff, Taper Tantrum, Grexit, Debt Bubble, ECB Contagion, etc. In India, the favourite reasons behind any correction are Participatory Notes (P-notes) crisis, Minimum Alternate Tax (MAT), Mauritius Treaty, General Anti-Avoidance Rules (GAAR), etc. The names change, so ‘fiscal cliff’ becomes ‘debt burden’, Double taxation treaty becomes P-Notes and so on and so forth.
- Growth concerns, inflation and oil prices seem to be omnipresent. Their respective magnitude and direction appear to keep changing. More often than not, the reasons for corrections have been global. All talk of the Indian market decoupling from the world markets is just that, talk!
- There is a common thread that runs through the ‘narrative’ above, and that is uncertainty. Uncertainty is ubiquitous to the ‘correction timeline’. As the level of uncertainty rises, investors tolerance for risk falls. It does result in investors paying less for
risky assetsstocks. As a result, stock prices correct. - The magnitude, reason and duration of any correction are unfathomable. Corrections seem to be like terrorist attacks. They are unpredictable and inevitable. It does make timing corrections almost impossible. A systematic investment philosophy and sector diversification, appear to be the only remedies to counter corrections.
- We have had twenty-one meaningful corrections since the calendar year 2004 and only one market crash in the year 2008. In most of the years, we have had more than one correction. It does seem to suggest that market corrections are the norm; crashes are the exceptions to the rule.
- Some of the corrections have been pretty scary, with the Nifty hitting lower circuit in the years 2004 and 2006. Despite their severity, these corrections did not culminate in a market crash.
- The calendar year 2014 is the ‘odd man out’. It happens to be the only year (since 2004) that markets were devoid of a ‘meaningful’ correction.
- The duration of each of the corrections highlighted above seems to suggest that bull market rallies are of a longer term than bull market corrections.
- The column showing annualised returns shows the importance of staying invested in equities as an asset class. The whole argument of capital markets being wealth destroyers more or less falls flat in the face after looking at the historical data.
- Looking at the returns for the calendar year 2011 highlights the fallacy of judging equities over shorter time frames of up to one year. In the long-run it hardly matters.
- From an investment perspective, it does mean that any iterations of the ‘narrative’ in the table above, manifest themselves as buying opportunities.
How Important is historical data for ‘Correction Analysis’?
How much weight should we give to historical facts while arriving at an investment decision? I keep writing in most of my posts that past performance is not indicative of the future. Why then, would the above historical correction analysis be relevant in any way?
John Kenneth Galbraith, an American economist, has famously said, “there can be few fields of human endeavour in which history counts for so little as in the world of finance”. The point he was trying to make is that the financial world does not take cognisance of historical facts and data in its real-time thought process. This is despite the fact that historical facts and data have time and again come to haunt market participants on a repeated basis. From an investment perspective, ‘History doesn’t repeat, but it does rhyme’ would be interpreted to mean that:
-
Even though historical facts and figures are bound to vary or are unlikely to recur in a direct manner, the context does tend to remain the same. Looking at the past can help in getting a clearer vision of what the future will look like.
-
In other words, one has to look at the historical data and come to a conclusion about strategies that have worked in the past. One then has to do an analysis why the strategy will continue to work in the future or why it may not work in the future, as the case may be. To me, that’s the key to using historical data and statistics in a profitable manner.
-
Like everything else related to equity markets, analysis of historical trends and corrections does work until it stops working!
When’s the Crash?
There will undoubtedly be many more corrections in the days ahead. Which of these will undergo the metamorphosis into a full-fledged crash? That is impossible to figure out. It is only with the benefit of hindsight that we will be able to judge which is which. Instead of trying to predict such outcomes, investors might be better off pondering over the following:
- There always have been and there will always be countless reasons not to invest in equities. Every time markets enter correction territory, the media goes berserk. In the ultimate analysis, most of what the talking heads predict turns out to be gobbledygook.
- Are we currently experiencing a regime change? Are negative interest rates and low commodity prices the new normal? Are things as bad as they are being made out to be? These are the ‘real-time calls’ each investor will have to take before he or she arrives at any investment decision.
- Regime changes don’t always spell gloom and doom. They work both ways. Emerging Market stocks have underperformed Developed Markets (read U.S.A.) for the better part of the last eight years. Would not a regime change also involve a shift in fund allocations from Developed Markets to Emerging Markets?
- There is a similarity between what is happening in the Emerging Markets space now and what happened in the year 1997. That was the year of the Asian Currency crisis. The specifics differ. The fear that 1997 is once again upon us has been widely publicised. What is not highlighted is the fact that forward returns for Emerging Markets for the next ten years after 1997 were extraordinary.
- Markets have rebounded from their lows. This is despite the fact that all the fears that were expressed as justifications for the downtrend remain just as they are. What has changed? In one word, the answer is sentiment. Investor sentiment is notoriously fickle and even more so over the short-term. That’s why they say, ‘don’t confuse brains with a bull market’.
In my view corrections offer opportunity to a long term investor. Quality stocks could be bought during the stabilization period, after so called crash. It is true that the vertical fall is difficult to ascertain, but if you already have such stocks in your portfolio you can accumulate with better purchasing power.
Illustratively, today if you have already invested in Wabco, Lupin, Page, Persistent, United Breweries and Kotak Bank, don’t you average these stocks aggressively, when the market falls, due to an unforeseen reason? Believe in the company, persons behind it and its business….ultimately they make you rich. Better to trust on figures than the graphs!
True. Also, investors need to start thinking long-term.