
(Source : Cartoonresource/Shutterstock)
With the bull market setting new high’s every week, it might seem preposterous to prepare for a correction. However, it does pay to be forewarned since, ‘to be forewarned is to be forearmed’.
Historical FII ‘flows’ in Q4.
The Indian market is heavily dependent on FII (Foreign Institutional Investor) ‘flows’. Any downturn in the market, has, more often than not, come on the back of FII selling. Is there a trend in the FII ‘flows’? I did a historical analysis of FII ‘flows’ for the calendar years from 2009 to 2013, for the period from June to December, and this is what I found (All figures are rounded of and in Rs. Crores):
FII ‘Flows’ 2009-2014
| YEAR | 2009 | 2010 | 2011 | 2012 | 2013 | 2014 |
| JUNE | 85 | 7,714 | 2,663 | 2,795 | 11,425 | 7,332 |
| JULY | 1,365 | 8,541 | 4,282 | 5,903 | 414 | 6,965 |
| AUGUST | 3,767 | 7,537 | 11,559 | 7,747 | 7,470 | 2,681 |
| SEPTEMBER | 13,331 | 22,476 | 3,089 | 20,808 | 11,176 | 5989 * |
| OCTOBER | 0.13 | 14,388 | 1,842 | 8,443 | 17,556 | ????? |
| NOVEMBER | 1,708 | 5,351 | 6,509 | 6,292 | 6,956 | ????? |
| DECEMBER | 4,241 | 722 | 2,387 | 14,366 | 13,466 | ????? |
* This is till Friday, 19 th September, 2014
(Source: Moneycontrol)
The month wise Nifty returns in percentage terms are given below:
Nifty Month-Wise Returns 2009-2014
| YEAR | 2009 | 2010 | 2011 | 2012 | 2013 | 2014 |
| JUNE | 5.27 | 6.89 | 0.99 | 9.03 | 1.63 | 3.38 |
| JULY | 6.81 | 2.21 | 2.58 | 0.94 | 2.66 | 1.13 |
| AUGUST | 1.05 | 0.54 | 9.35 | 0.34 | 4.47 | 4.63 |
| SEPTEMBER | 9.91 | 10.2 | 1.92 | 8.56 | 3.32 | 1.17 (*) |
| OCTOBER | 7.31 | 2.05 | 9.84 | 1.73 | 8.98 | ?????????? |
| NOVEMBER | 10.27 | 4.17 | 8.10 | 4.16 | 0.16 | ?????????? |
| DECEMBER | 1.54 | 2.91 | 6.33 | 0.58 | 1.39 | ?????????? |
(*) This is till Friday, 19 th September, 2014
(Source: Nseindia.com)
From the data given above, we can easily draw the following conclusions:
- It is apparent that FII inflows do ‘taper’ off in October and November, in each calendar year.The calendar year 2013 was an exception, the reasons for this are well documented. They are not relevant for the current calendar year.
-
The FII juggernaut does seem to start rolling from December onward.
-
There is a one to one correspondence between, Nifty returns and FII ‘flows’. However, it is important to note that this is only in the direction of the market, not in the magnitude of the change. In other words, small FII outflows at times lead to big corrections and vice versa.
-
Since the FII’s operate with a ‘herd’ mentality, this has a consequential impact on the ETF ‘flows’ in to the India Specific ETF’s listed in the U.S.
-
This does not mean that the market will fall off a cliff. It definitely means that index wise gains for the last quarter are likely to be muted. It seems, to me, that the market is likely to be sideways, with a downward bias. This does not mean that it is time to go short.
-
What I am effectively warning against is ‘complacency’, which, I think, has set in. The bull side of the street is getting a little crowded. What do you expect, with so many skeptics ‘crossing over’.
-
In the Global universe, the last fortnight has seen the longest decline in Emerging Market stocks for over a decade. On Friday, 19th September, 2014 the MSCI Emerging Market Index closed at 1053.92, 4.56 % below it’s 52 week high of 1104.31, set on 04th September, 2014. Have a look at the image below, which shows the movement of this index for the last three months. Is this just a correction or will it continue?
MSCI EMERGING MARKET INDEX
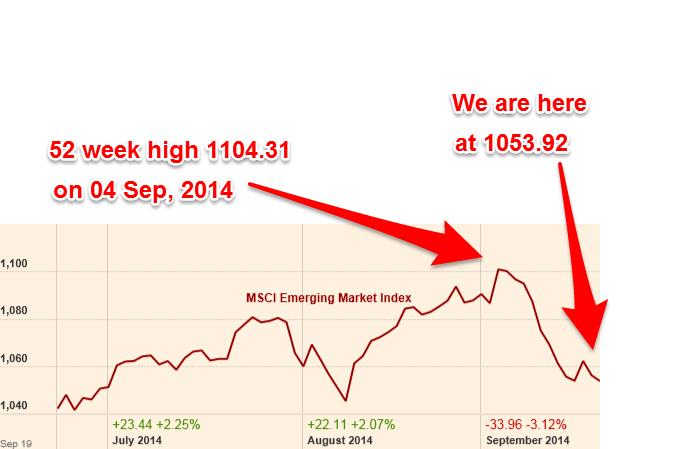
(Courtesy : The Financial Times, London)
Volatility and bull markets
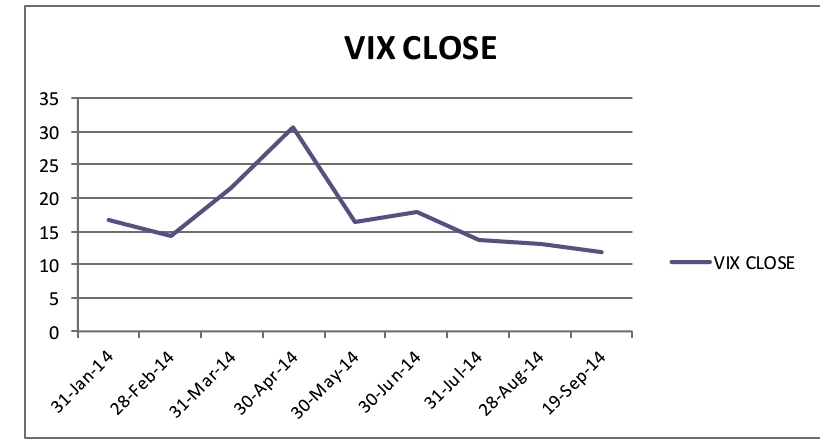
Is it easy to make money in a bull market? I think not. It just looks easy in hindsight. Why? The volatility generally makes it difficult for people to hold on to their ‘buys’. A stock market devoid of volatility would yield lower returns. Volatility is common in bull markets. It is a necessary evil. One has to ride it to seek market like returns over time. This has been a placid year so far. The volatility has been abnormally low this year. The chart below shows the India VIX (Volatility Index) for the year 2014.
The market has been trending upwards from April 2014. After a 29 % upside in the Nifty, the sentiment is mixed. In other words:
- It has settled to the middle, neither bullish nor bearish.
- In such situations we generally have something different happening. A big up or a big down – extremes.
-
In the current situation Bulls have become less bullish. The bears are tiring of the being the boy who cried wolf. In such situations, markets tend to surprise both the camps.
-
In other words, the volatility will go up. Volatility does not necessarily mean negatives, positives can be equally volatile. We don’t need to be worried about positive volatility. The negative volatility is, effectively, the cost of doing business for an equity investor. Negative volatility means a correction which is usually defined as 10 %.
Bull Market Corrections – Characteristics
All bull markets have to go through corrections. A correction is a sentiment driven, sharp and short move, of around 10 % or more. There is no fixed percentage as such. The characteristics of corrections are:
- Corrections typically start without warning and are impossible to forecast. They last for a few weeks to a few months.
-
Corrections in bull markets are generally steep. Corrections are refresher’s, providing a ray of hope to bears, that their predictions are finally coming true, and a reality check for bulls.
-
Bull market corrections are driven by sentiment and not by fundamentals. Sentiment swings on a dime. Corrections caused by sentiments and not by fundamentals, tend to be fleeting.
-
The problem is compounded by the fact that timing the market is almost impossible on a consistent basis. Corrections can occur for a variety of reasons. Even when everything appears to be going along merrily, markets often take a breather.
-
Navigating around corrections requires near perfect timing, at the top, and at the bottom, some thing which is impossible to achieve repeatedly. There is no one who has a consistent and well documented history of timing corrections. When you get the beginning right it is only half the equation. To navigate a correction, every investor has to buy back in at some point in time. The lower the market goes, the higher the fear. This prevents investors from buying back in.
Bull market corrections : 2004 – 2008
Since corrections are inevitable and cannot be timed, what I did was to study past corrections with the following parameters:
How far can stocks drop?
How long can corrections last?
I did a study of past corrections in the bull market from 2004 to 2008. I have only considered corrections which were greater than 8 %. The year wise corrections were as follows :
| Date | High | Date | Low | Days | Loss% |
| 14/01/2004 | 1982.15 | 22/03/2004 | 1685.00 | 68 | 14.99 |
| 23/04/2004 | 1892.45 | 17/05/2004 | 1388.75 | 24 | 26.62 |
| 24/05/2004 | 1608.85 | 23/06/2004 | 1446.10 | 30 | 10.12 |
| AVERAGE | 41 | 17.24 | |||
| Date | High | Date | Low | Days | Loss% |
| 08/03/2005 | 2168.95 | 29/04/2005 | 1902.50 | 52 | 12.28 |
| 04/10/2005 | 2663.35 | 28/10/2005 | 2316.05 | 24 | 13.04 |
| AVERAGE | 38 | 12.66 | |||
| Date | High | Date | Low | Days | Loss% |
| 10/05/2006 | 3754.25 | 14/06/2006 | 2632.80 | 35 | 29.87 |
| 05/07/2006 | 3197.10 | 19/07/2006 | 2932.75 | 14 | 8.27 |
| AVERAGE | 25 | 12.71 | |||
| Date | High | Date | Low | Days | Loss% |
| 07/02/2007 | 4224.25 | 05/03/2007 | 3576.50 | 26 | 15.33 |
| 24/07/2007 | 4620.75 | 21/08/2007 | 4074.90 | 28 | 11.81 |
| 15/10/2007 | 5670.40 | 22/10/2007 | 5184.00 | 7 | 8.58 |
| AVERAGE | 20 | 5.95 |
The above data shows that bull markets do not go up in a linear fashion. They generally tend to correct between 10 to 15 %. Also, bull market corrections generally last for a period from a month to 45 days.
The corrections in the current calendar year are as follows:
| Date | High | Date | Low | Days | Loss% |
| 22/01/2014 | 6338.95 | 04/02/2014 | 6000.90 | 13 | 5.33 |
| 23/04/2014 | 6840.80 | 07/05/2014 | 6652.55 | 14 | 2.75 |
| 07/07/2014 | 7787.15 | 14/07/2014 | 7454.15 | 7 | 4.28 |
| 24/07/2014 | 7830.60 | 01/08/2014 | 7602.60 | 8 | 2.91 |
| 08/09/2014 | 8173.90 | 16/09/2014 | 7932.90 | 8 | 2.95 |
| AVERAGE | 17 | 6.07 |
What to expect?
- I am aware that the U.S. market has been devoid of a 10 % correction for more than two years. However, I do not think this statistic is comparable. Why? The reason being that we are an ’emerging’ market, and their’s is a ‘developed’ market. Historically, emerging markets are more volatile and are prone to huge swings in investor sentiment. Effectively, for us, the term ‘investor sentiment’ means ‘FII sentiment’.
- Individual stocks have been correcting on an ongoing basis. The benchmark indices have yet to see a meaningful correction in this calendar year.
- Most investors tend to be unhappy as markets start correcting. The stock market is the only place where people tend to get unhappy as prices decline. They should, in fact, welcome declines and buy good stocks with a long-term view-point.
- Markets always look easy with the benefit of hindsight. If you think you are investing in the stock market for out sized returns, be prepared for greater volatility as this bull chugs along.
- We have an army of pundits calling for ‘healthy’ corrections. In stock markets, what begins as ‘healthy’ turns into ‘scary’ pretty quickly. It is this fear psychosis that makes money-making in a bull market pretty difficult. I would go to the extent of saying that it is easier to make money in bear markets than in bull markets.
- Charlie Munger has said “I’m convinced that everything that’s important in investing is counter-intuitive, and everything that’s obvious is wrong”. Stocks have a knack for confounding consensus expectations. If most prognostications think X will happen, you can be relatively sure it wont. So, in short, try to keep guessing what everyone else is expecting. If you do manage to find out, don’t forget to share it with me!!.
I certainly hope you are right and that it is indeed a 4 year or more bull market. However, no bull market goes in a straight line like this one has been going. The FII’s control our market and their influence has been increasing over the years. This, however, is true for ALL emerging markets. Phases of this market, I think very subjective. Each of us will have our own opinions on that.
Dear Yashodhan,
A very well studied and written article as usual.
According to me there are 3 phases broadly abt bull markets:
1. bottoming out of a bear phase…… means when PEs of a , 10 year govt paper and the countrys premier indices are same…. eg pe of around 7.
2. Later on, slow accumulation starts based on recovery of all sorts in the economy for atleast 18 to 24 months. Here PEs for Equity mkts may reach upto 15 .
3. Then lastly , final leg of point of inflexion comes whereby PE will reach even up to 25 on avg for say, NIFTY. Then it may remain in the band of plus or minus ten percent depending upon the continuation of growth story for the country, provided global geopolitical situations are fairly stable.
Thereafter …… what?……… A DECENT correction.
Here in our country, The markets have entered into 3 rd phase, without any clear signs of revival. This is mainly due to the MODI s superstrong govt at centre( atleast in numbers , unless they deliver the performance tooo….)
So , in short….. acco to me a lot of over optimism is build into the level of NIFTY……
Now, whether it can carry on with a little bit of cerrection up to say 7867 nifty cash, and then recovers, my feel is that it will carry on the bull trend in the same speed and 8300 is the level where it will stabilise , for further signs of reforms !
Also one has to take into consideration that all good counters or stocks are being bought by all savy investors with a long term view, so supply will get dried up unless the govt fails to perform and deliver.
Steps taken to lower the Fiscal Deficit and even Current Deficit by the Govt are admirable and will definitely give positive results.
Net, net- its an ongoing bull run for the next 4 years, acco to me.