As we approach the end of the voting and get closer to the announcement of the results i am just wondering what to expect from the market, volatility is a given and i thought it would be in the fitness of things to delve into the past elections and see if any inferences can be drawn therefrom. The reason for looking backwards is logical since the stock market is basically cyclical in nature and the cycles tend to repeat since behavioral patterns don’t change over time. The cycles themselves aren’t predictable but the fluctuations can be counted upon to recur and that is why it is said that “History doesn’t repeat itself but it does rhyme”. In other words the details generally wont repeat but the rhyming pattern will. So this is an attempt to see if any lessons can be learnt from the past and whether investors can be forewarned of risks and opportunities with the benefit of hindsight. The majority of the comparisons are with the year 2009 but at times i have also included tit bits from earlier years, so here goes :
1. The skepticism about equity and the economy is very high now and was very high in the year 2009. In fact in the year 2009 the expectation was of a third front government and nobody expected the incumbent UPA to return to power. In spite of this the NIFTY rallied from a low of 2573.15 on 09 Mar 2009 to a high of 3683.90 on 07 May, 2009 i.e a rally of 43 %. This is before the election results were announced and on the backdrop of very low expectations and what actually happened is history. In the current election year so far the NIFTY has hit a low of 6000.90 on 04 February 2014 and rallied to close at 6782.75 on 25th April, 2014 i.e a rally of ONLY 13 %; in 2009 the base was lower (but percentages don’t lie), and in the current year the rally is on the weight of very high expectations. In fact on the background of very high expectations the rally is minuscule. Does it mean there is still steam left or is the market indicating something else? Is the market inclined to top out before results or is it the “ain’t seen nothing yet” syndrome?
2. In the beginning of the year 2009 there was a big accounting scam of a listed entity viz SATYAMCOMP and in the year 2014 we had a similar situation where the management of a public sector bank viz UNITEDBNK said that their books were actually cookbooks. Yes the market capitalization is not comparable but the resemblance is uncanny.
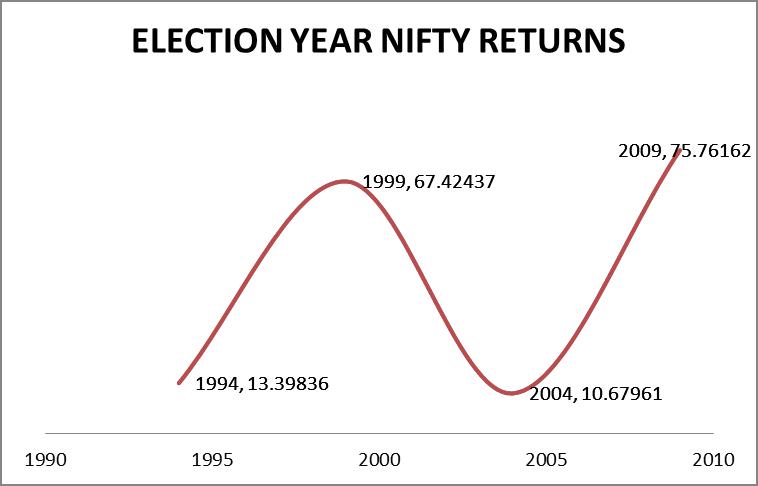
3. The NIFTY has given positive returns in every election year as can be seen below. ( The calendar year and the % returns are shown). What is pertinent to note in that in the period from 1990 to 2004 the country had 6 Prime Ministers and the average return is 18.25 % p.a. in that period (The NIFTY actually started trading from October 1994 but has been back tested from 03rd July 1990, returns calculation is the arithmetical average of the yearly percentage returns on 31st Dec of the respective calendar years)
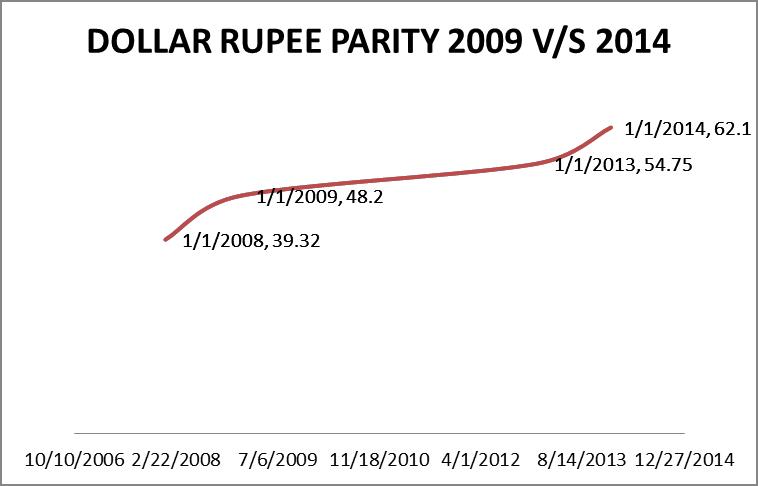
4. The Rupee dollar parity in the calendar year prior to the election year was 39.41 on 01/01/2008 and 48.53 on 01/01/2009 i.e. the rupee depreciated by around 22 % . The corresponding values now are 54.68 on 01/01/2013 and 61.75 on 01/01/2014 i.e. a depreciation of 13 %. If one were to consider the lowest that the rupee had sunk in 2013 the depreciation would have been similar but we were saved by the heroics of our new RBI governor.
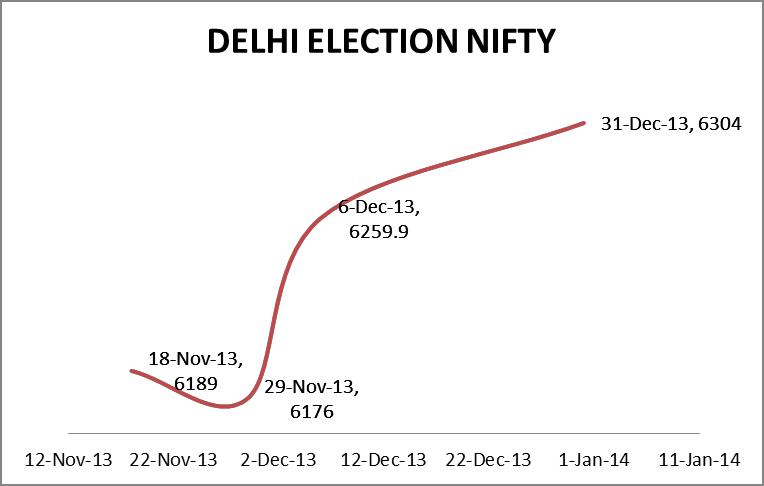
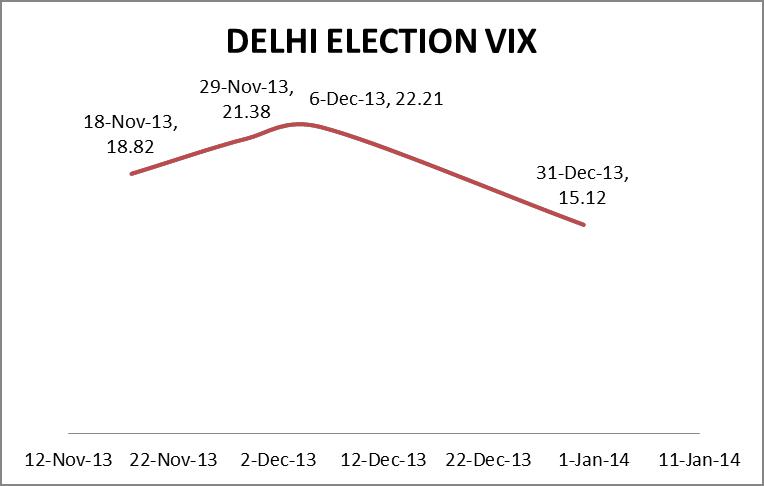
5. In terms of valuations the jury is out on whether the market is over, under or fairly valued at this juncture, so there is no point getting into that. An important observation is that the NIFTY and the INDIA VIX (Volatility Index – predicts market volatility in the next 30 days) are both moving in the same direction, this is a little odd since they normally move in opposite directions i.e when the VIX goes up the NIFTY goes down and vice versa. A falling VIX means that market confidence is high and is generally accompanied by a rising NIFTY. A rising VIX shows that market confidence is low and is generally accompanied by a falling NIFTY. What a rising VIX and a rising NIFTY show is open to debate. However it will be interesting to see the direction as we get closer to the results date and i feel that one of the two has to change directions. The data for the India VIX in 2009 is not comparable since it was launched only on 02 Mar 2009 and began trading on 26 February, 2014. A good comparison is the recent Delhi elections and there too, the VIX and the NIFTY rose in tandem but after the results the VIX changed course. It is clear from the graph that the VIX has almost doubled in the last one month whereas the NIFTY has barely moved 5 % in the same period.
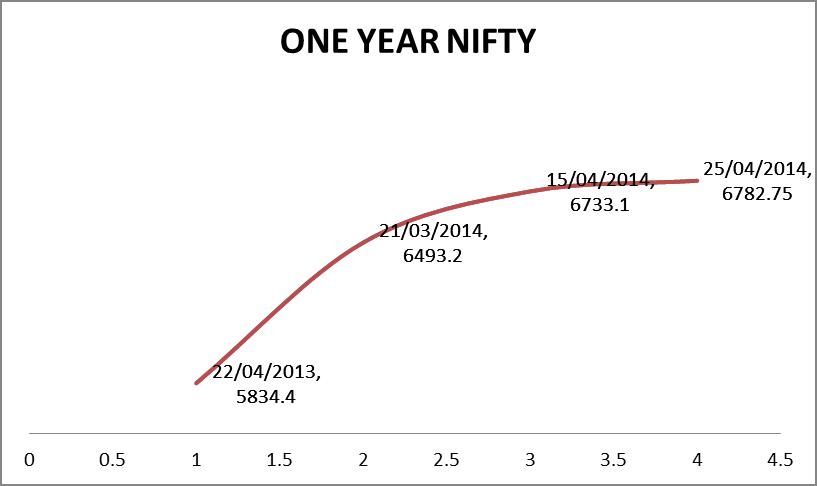
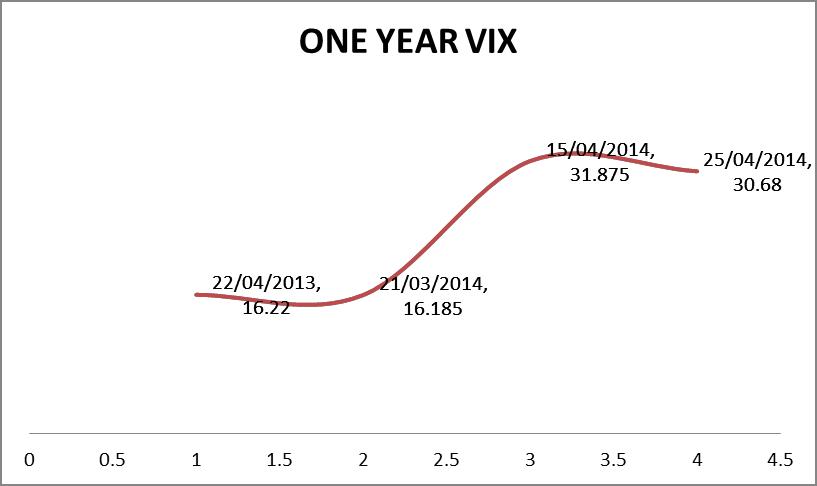
The NIFTY and the VIX direction is the same in the charts above and for the sake of comparison the recent Delhi by elections also had a similar graph till the date the results were out on 08 Dec 2013 but the VIX changed course subsequently as can be seen below. In other words the direction of the VIX should be a good indicator of the direction of the NIFTY in the immediate aftermath of the results.
6. If one were to go back to the year 2004 when the UPA first came to power with the help of the left parties one would recollect that the market underwent a severe correction after the results on the premise that the economic policies would be dictated by the left parties, of course the market quickly forgot and went on to post multi-year highs in the aftermath.
7. A statutory warning (if that is what it can be called) PAST PERFORMANCE IS NOT INDICATIVE OF FUTURE RESULTS!!!!