(Cartoonist: Dave Carpenter; Cartoonstock.com)(Sunday, 24 April 2016)
The Nifty is light years away from making a new All Time High. Stocks, however, are behaving differently. Many stocks are hitting new All Time Highs and new All Time Lows.
A new All Time High or a new All Time Low is not the same as a 52-week high/low. The words ‘All Time’ are used to highlight a price that has never been seen before in the trading history of the respective stock. Hence, stocks that breach ‘all-time’ levels are special.
New All Time Highs v/s New All Time Lows
Should you sell a stock making a new all time high and buy one making a new all time low? The verdict of the punditry is unanimous: investors are better off buying stocks that hit new All Time Highs than buying stocks that hit new All Time Lows. The reasons for this are:
- Clearly the wind is at the back of stocks making new All Time Highs. New All Time Highs signify strength. It means that in the event of a correction, these stocks will be comparatively resilient.
- A new All Time High would signify that there is practically no one nursing a loss or waiting to ‘get even.’ Since there is no prior occurrence of the price, it does mean that nobody is waiting to sell and ‘get out.’
- Markets tend to discount most events and incidents in real-time. The fact that a stock is hitting a new All Time High means that there is more to the price action than meets the eye.
- In secular bull markets, new All Time Highs are endemic. The jury is out on whether this is a secular bull market. Without getting into the argument of whether or not this is a bull market, the fact that a bunch of stocks is making new All Time Highs when the Index is not, is to my mind significant. I wouldn’t want to ignore these stocks.
- Technical analysts consider historical All Time Highs as a resistance level, one that would act as a barrier to further upward price action. The reason is that there usually are a lot of sellers at that price, waiting to get out. Traders are tempted to try to ‘hit the top’ by going short at All Time High levels. Once prices punch through that level, buyers outnumber sellers. Inevitably, it sets the stage for a leg higher. It is what the TA (Technical Analysis) guys call a breakout.
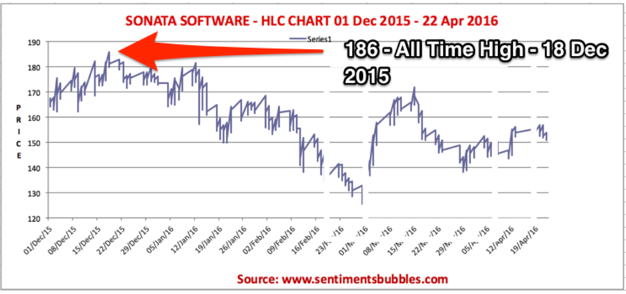
- Stocks that hit new All Time Highs appear to be invincible; they are not. In other words, not all breakouts end up with the desired follow-up. Take a look below:
The image shows a failed breakout in Sonata Software Limited (SONATSOFTW). The price hit a new intra-day All-Time High of Rs. 186 on 18 December 2015. It also closed at a new All-Time High on that day. However, the follow-up price action is missing. The stock corrected with the market. (This is only illustrative, I have no trading positions in SONATSOFTW).
In the case of stocks making new All Time Lows, everything that is stated above applies mutatis mutandis to this category as well. The difference is that instead of buying the breakout, we would be selling the breakdown. Most of us are more comfortable, buying first and selling later. As a result, playing the long side of the trade is popular.
What about buying stocks making new All Time Lows?
In the case of stocks hitting new All Time Lows, the risk-reward ratio is favourable. At some point, a selling climax is bound to be reached, and the accelerated decline will get arrested. It is what Charlie Munger means he says; “Invert, always invert.” In my opinion, not at all easy. In the managed money space, those who have achieved investing success using inversion as a strategy, are few and far between. These select few have a permanent place in the investing hall of fame. Not an advisable strategy for the retail investor.
Which Stocks are making new All Time Highs & new All Time Lows?
I have tried to list out the names of the stocks that are making new All Time Highs and new All Time Lows. The period of reference is from 01 March 2016 till date. This data is not readily available; it has to be derived. As a result, I prefer to think of the list as indicative and not exhaustive. You can download the list of stocks making new All Time Highs and new All Time Lows by clicking Download.
How should an investor use the data? One doesn’t know if the prices are lying or telling the truth. As a result, investors would be well advised to follow the maxim: “Trust, but Verify.” The following points are critical:
- Only stocks listed on the National Stock Exchange of India (NSE) have been considered. The prices shown are not necessarily closing values. In some cases, they may have been hit intra-day.
- Historical All-Time Highs and Historical All-Time Lows, are arrived at using weekly closing prices. Some amount of objectivity tends to creep in since one doesn’t know which Historical price to present.
- In all cases, whether it is a breakout or a breakdown, it ought to be an indication for investigating the reasons for the same. In other words, just trading the price blindly because of a breakout or a breakdown is fraught with risk. A breakout or a breakdown is a starting point. One then has to do the additional work required for arriving at an investing or trading thesis.
- There is no silver bullet on trading strategies, least of all for stocks hitting All Time Highs and All Time Lows. In the case of stocks hitting new All Time Highs, one of them will be a new lifetime high that may not be breached for years to come. In other words, please do consult your financial advisor before making a buy or sell decision.
What about Investor Sentiment?
Moving on to markets, I have always considered sentiment as one of the biggest catalysts. The indices have been on a roller coaster since the beginning of the calendar year. Of late Volatility has subsided. Emerging Markets and Commodities have recovered smartly. Sentiment hasn’t. Investors couldn’t care less about markets and their direction. What could be the reason for dour investor sentiment? (I am referring to the retail investor, not the institutional one.)
According to me, it has nothing to do with fear and anxiety about the economy, oil prices, interest rates or anything else. I can think of one singular reason. It is a bit profound; I need to explain. When collective investor sentiment swings from bearish to bullish and vice-versa, it sets the stage for stock market cycles. Excessively bullish sentiments lead to the formation of bubbles. However, bubbles are the exception, not the rule. Unfortunately, in the decade spanning the years 2000-2010, the market witnessed two bubble formations. The dot-com bubble at the beginning of 2000 and the aftermath of the U.S.Housing fiasco in 2008. In both instances, indices corrected by over fifty percent. Two bubble formations within a decade is an aberration. As a result, individual investors don’t trust the market anymore. I suppose, it would take a ‘generational change’ for investors to begin believing and investing in stock markets of their volition.
Was Mark Twain alluding to investors when he wrote these lines? “If a cat sits on a hot stove, that cat won’t sit on a hot stove again. That cat won’t sit on a cold stove either. That cat just don’t like stoves.”


very good article pls recommend scripts also
Thanks. I think FINPIPE is a safe bet
Yashodhan
when I submit the ‘Download’ and submit my details, i get the following error:
Error!
This email was not found on our membership list. …
Can you please help?
You have to enter the email id with which you have subscribed to the newsletter
yashodhan
Very good write up and analysis
regards
shirish deshpande
Thanks
Yashodhan
Nice article and sound advise!
Shailesh
Thanks