(Source: Cartoonresource/Shutterstock)
One of the very valid criticisms about research and stock predictions, is that it is made on the basis of past and historical data. This data cannot be said to be predictive. The Leading Economic Index published by the Conference Board, on a monthly basis, is a futuristic indicator. I have mentioned it, fleetingly, in the past (you can read about it here).
The Conference Board
Acknowledgements : I wish to thank the Board and their economist Ms. Jing Sima-Friedman in particular, for being very cooperative, patient, prompt and helpful. She has taken on a leading role in developing composite economic indexes for India. She can be reached on Jing.Sima@conference-board.org.
The Conference Board is a global, independent business membership and research organisation working in public interest. Its headquarters are in the U.S. There is an India office in Mumbai. The salient features of The Leading Economic Index (LEI) are:
- LEI stand for Leading Economic Indices which are published on a monthly basis by The Conference Board.
- These are said to be futuristic in their outlook.
- The Conference board Leading Economic Index for India was launched in September 2013. It has been back tested from April 1990.
- It seems that this indicator has correctly signaled turning points in the Indian economic cycle in the past.
The Conference Board LEI for India, effectively aggregates eight economic indicators that measure economic activity in India. Each of the LEI components has proven accurate on its own. Aggregating individual indicators into a composite index, filters out so-called “noise”, to show underlying trends more clearly. As per the information given on their website, the eight components of the The Conference Board Leading Economic Index for India include:
- Interest Rate Spread (10 year government bond minus 91 day treasury bill)(RBI)
- Stock Prices: Sensex Average (Bombay Stock Exchange Ltd)
- Real Effective Exchange Rate Index, 36 countries (RBI)
- Real Money Supply: M3 Bank Credit to Commercial Sector (RBI)
- Merchandise Exports, f.o.b. (Ministry of Commerce and Industry)
- Cargo Handled: (Domestic and International (Airport Authority of India)
- IP: Capital Goods (Central Statistical organization)
- PMI: Services Business Activity (HSBC/Markit)
The weights for all eight components of the index are equal. However, each is given a ‘standardization factor’. The more volatile a particular component is, the lower is it’s standardization factor. This way, the more volatile component would not affect the composite index. I think, this ensures that the LEI gives a balanced picture. Also, the last six months of data is revised, with every month’s new release. The whole index is revised once a year, in January, during the annual benchmark revision. This is done to incorporate revisions in the underlying data.
LEI and the Nifty
During the course of my analysis of the LEI, I realized that the historical data does not show a ‘perfect correlation’ between the LEI as published by the Conference board, and the Nifty. In an emailed response, (which I have reproduced verbatim), the explanation that was offered for this was as follows :
- Though the LEI and the stock prices are often correlated, (and the stock prices are a component of the LEI), the two are not always in sync with each other.
- The composite index (LEI) includes other indicators, such as business and consumer sentiment surveys, new orders of manufacturing sector, exports etc.
- The upticks in the stock market may be offset by drops in real estate, manufacturing, or other sectors in the real economy. When stock prices increase or decrease, the economy may not reach turning points. In fact, stock price fluctuations happen much more often, and are much more volatile than economic cycles.
- Stock prices also tend to have a longer lead before a recession (or growth cycle) in the overall economy, because it is a sentiment indicator, and tends to move way ahead of other economic indicators.
- The purpose of having a composite index of leading indicators is to filter out such volatility (noise), in each indicator, so that, the underlying trend of the economy becomes clear to identify recessions.
- The LEI is designed to signal the direction of the overall economy, not the stock market.
- The nature of the Indian stock market is a bit different from that of China and emerging Asia, in the sense that India receives the most overseas stock investment in emerging Asia, and India’s stock market is very much driven by foreign investors.
- Thus, even though domestic economy and investment are sluggish, stock prices can decouple from domestic economic conditions and rise significantly on the back of foreign investors chasing returns. This may partly explain, why movements in the stock prices and the India LEI are not always in sync.
Yashodhan here, I think the reply, pretty much, says it all. Also, in Indian conditions, due to the reasons mentioned above, the stock prices are likely to realign with the economic realities. In stock markets, however, this generally takes its own sweet time.
Historical Comparison of the LEI with the Nifty
I thought it might be worth while to see if this indicator has, indeed, signaled economic turning points as is claimed. On the basis of the data for the LEI from April 1990, I back tested the same and plotted it against the Nifty.
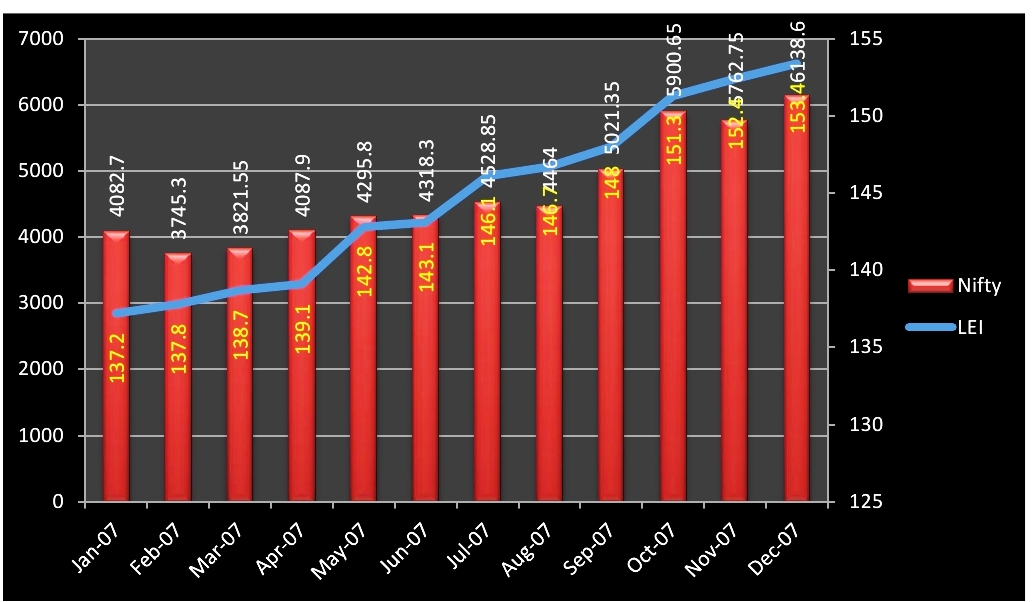
2007
In 2007, they have risen, and the market seems to have caught up with them.
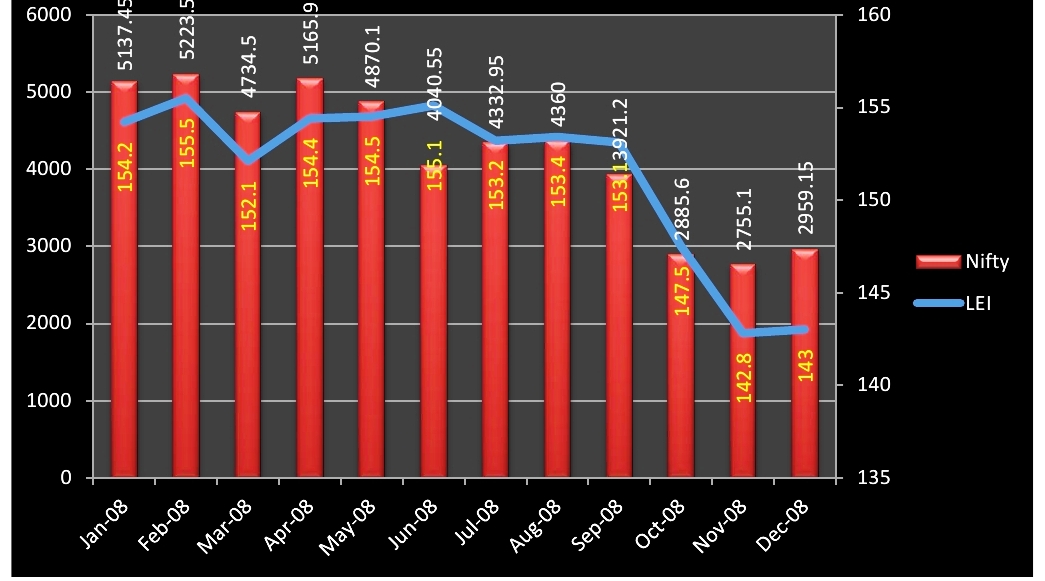
2008
In 2008, they have shown the direction, and the market has followed. In fact the market has run ahead only to correct subsequently.
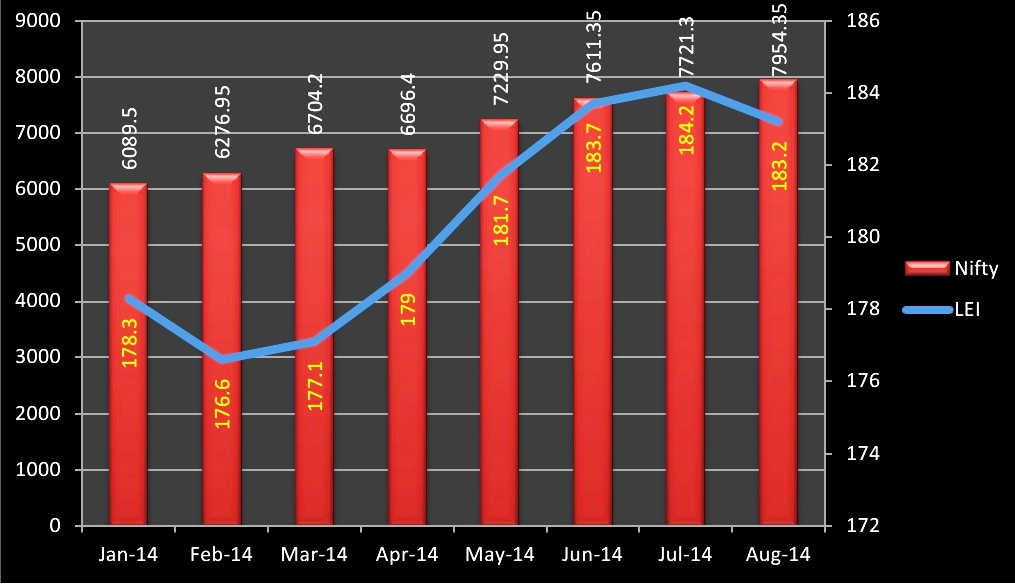
2014
In the current year, the market has run up, and the LEI seems to be catching up. There is fall in the LEI in August this year. The fact that the LEI has flattened, and actually fell in August, does not mean that it is a time to head for the hills. However, it is definitely worth tracking since historically the market does seem to catch up.
Conclusion
The above does show the following:
- The LEI’s do seem to rise and fall before the market.
- As is usual in markets, there can be no foolproof method for predicting market direction.
- I know people follow astrology, charts, fundamentals, monthly and yearly trends. They can add one more to the list. This is the only one which is based on the economy as a whole. If you look at the components, I think it pretty much covers everything which defines an economic expansion or contraction. Also, the fact that the exchange rate is considered is welcome, since major moves in stock markets, all over the world, have all had the exchange rate as the starting point.
- No recession starts when the LEI is rising. A rising LEI implies future growth. The LEI has the characteristic of falling many months before any economic recession. The unique thing about this indicator is that, if it falls, it does not mean we will have an economic recession. The inverse, i.e. if it is rising, you can be sure that we will not have an economic recession.
- Actually, to get a full picture of the economy it is necessary to look at many variables. No one statistic from any category gives a complete, perfect measure of economic activity. Hence looking at all the data is a must. This is what the LEI does. It paints a fairly reliable picture of future activity. It has predictive power because it uses forward-looking economic variables like yield curve, credit availability, new orders and stock prices. Most of the indicators which are in vogue at present, are backward looking.
- In the current scenario, we have central banks all over the world running their printing presses overtime to avoid economic recessions. After the Fed, it was Japan and then the Euro zone. The latest is China, which has announced a U.S. $ 80 billion stimulus. The components of the LEI are a pleasantly reassuring. The most important thing, is that it does not factor government spending. So effectively the QE’s are left out, which I think is a good thing. Also for most laymen like you and me, it is impossible to understand all the components individually. They are just to intricate. It is best left to the experts. It helps to have an indicator like this one, which gives you the whole economic landscape in one figure, and that too on a monthly basis.
- I am pretty enamoured with this ‘magic’ indicator. It is not surprising, that it is popularly said that the LEI don’t lie.


The LEI from Apr 1990 is available. Too cumbersome to put all the images in the post. Moreover, there is a lag as I have mentioned. I thought we should be most concerned with 2014, so I put that one and 2007/2008 for giving an indication. I think BDI is more for freight on the high seas. This one is composite. Liquidity, easy money, QE has helped, no doubt about that.
One more thoughtful and well researched and thought provoking article.
Thanks!
I would have liked to see the entire LEI line for the period from 2007 thru today…
Is there a link where this can be referred to….
I also feel that the QE is a huge contributor to the Stock Mkts bullish behaviour rightly captured through the FII inflows into stock markets in India and by Banks investing in the stock mkts world over….
Credit off take and bad debts would also be interesting indicators to account into the LEI….
Finally, I am also left wondering…
What happened to the BDI (Baltic Dry Index) as a lead indicator?