(Source: www.shutterstock.com/cartoonresource)
CAPE valuations of Indian Equities show that India is the most expensive Emerging Market (EM). Is that the only reason for the underperformance of the Nifty?
What is CAPE?
CAPE is the acronym for the Cyclically Adjusted Price to Earnings ratio. The CAPE ratio was derived by Professor Robert Shiller and has the following characteristics:
1. We all know that a Price Earnings (PE) ratio is the Current Market Price (CMP) divided by the latest Earnings Per Share (EPS) of the company. Robert Shiller (who won the Nobel Prize in Economic Science in 2013) popularized the concept of the CAPE ratio. While computing the CAPE, instead of the regular earnings, we consider the average of the last ten years earnings after adjusting them for inflation.
2. Professor Robert Shiller felt that if we could smoothen out the economic cycle of recessions and expansions we would get a ‘true’ picture of the stock markets historical earnings. Once we have this, we can then proceed to arrive at an under-valuation or over-valuation argument. The idea though simple was a brilliant one. It does have adherents across the financial academia. At the same time, it has also been severely criticised.
3. The logic is something like this. If you use the conventional PE ratio, you end up using the latest earnings. While looking at economic cycles, the CAPE ratio tends to smoothen the denominator. The advantages of using the CAPE are:
- It represents a balanced view of a company’s earnings. Single year earnings are tilted in favour of or against where we are (boom or bust) in an economic cycle. CAPE is work around. As compared to the popular PE ratio, CAPE is a ‘fair’ way of judging valuations from a historical perspective.
- In India, we have always suffered from high inflation. Hence, adjusting earnings for inflation does seem to make a lot of sense in the Indian context.
4. As current CAPE valuations diverge from the historical CAPE valuations, markets tend to get stretched or crushed, as the case may be. ‘Reversion to the mean’ is expected to occur at all such times. The accepted norm or ‘rule of thumb’ says that any market with a CAPE, which is below 15 is considered as cheap, and any market with a CAPE above 20 is considered as expensive.
5. How does an investor use the CAPE ratio? I don’t think investors should use the CAPE ratio to time markets. They should, instead, click here and read what Professor Robert Shiller has to say on this.
What is the CAPE ratio of the Indian market?
The table below shows the CAPE ratio for the BRIC countries.
| INDIA | CHINA | BRAZIL | RUSSIA | |
| CAPE – AS ON 30/09/2015 | 18 | 12 | 8 | 5 |
| MAXIMUM | 49 | 49 | 28 | 24 |
| MEDIAN | 22 | 18 | 16 | 7 |
| MINIMUM | 16 | 11 | 8 | 5 |
| EXPECTED RETURN (%) | 4.2 | 7.7 | 11.6 | 14.1 |
(Source: Research Affiliates)
1.The rows that show the ‘maximum’ and ‘minimum’ CAPE are indicative of extreme ends of the valuation spectrum. CAPE ratios for Brazil and Russia have been setting new lows (with respect to their historical valuations) in the current calendar year.
2. From the above data, the following is apparent:
- Looking at relative valuations, India is the most expensive among the four.
- If one considers the median valuation as being normal, Brazil is the cheapest. India again is the closest to its
mediannormal valuation. - CAPE valuations suggest that expected future returns from investing in Indian equities are the lowest.
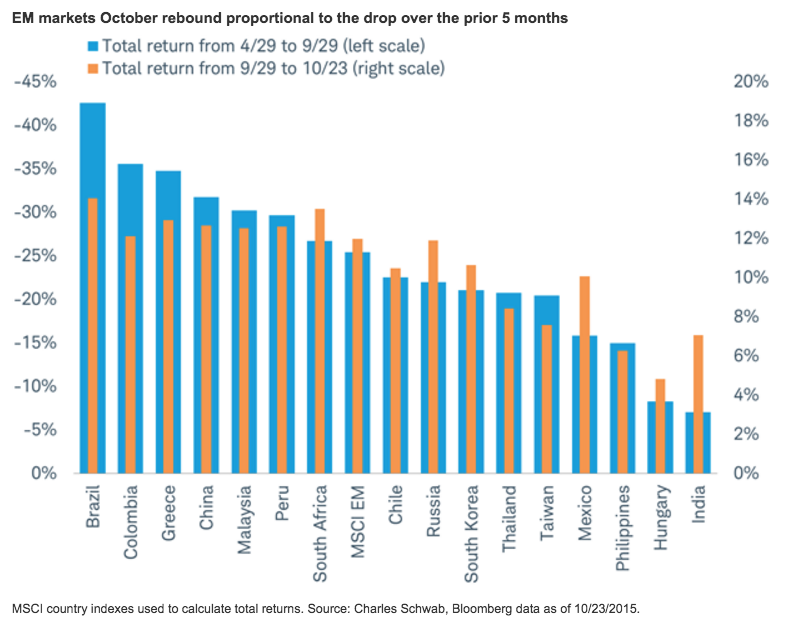
In other words, the Foreign Institutional Investors (FII’s) have a choice. The EM universe comprises of roughly forty-three countries. There are cheaper Emerging Markets (EM) available with higher expected rates of return. This is amply demonstrated in the image below.
It is apparent that Indian markets are underperforming their EM peers in the recent pull back. CAPE valuations are not the only reason for this underperformance. CAPE is one of the reasons. The other reasons for the underperformance could be:
- EM’s that fell the hardest have bounced the highest. Using CAPE valuations, a lot of FII’s see opportunities for ‘value investing’ in Russia, Brazil and other EM’s.
-
Even if one were to ignore CAPE valuations and resort to a price to book value metric, Indian equities appear expensive. As on date, India trades at 3.2 times book value as compared to the EM’s as a whole, which trade at 1.4 times.
Should we worry about CAPE valuations?
From a long-term perspective, I wouldn’t be too worried about CAPE valuations for Indian equities. In bull markets, equities do tend to remain expensive. That’s pretty normal. Are low price-earnings multiples safe? Can price-earnings multiples predict stock market returns? I have written a post on price-earnings multiples earlier. I wouldn’t want to repeat myself. Click here to read that post.
Is CAPE the ‘Elephant in the Room’?
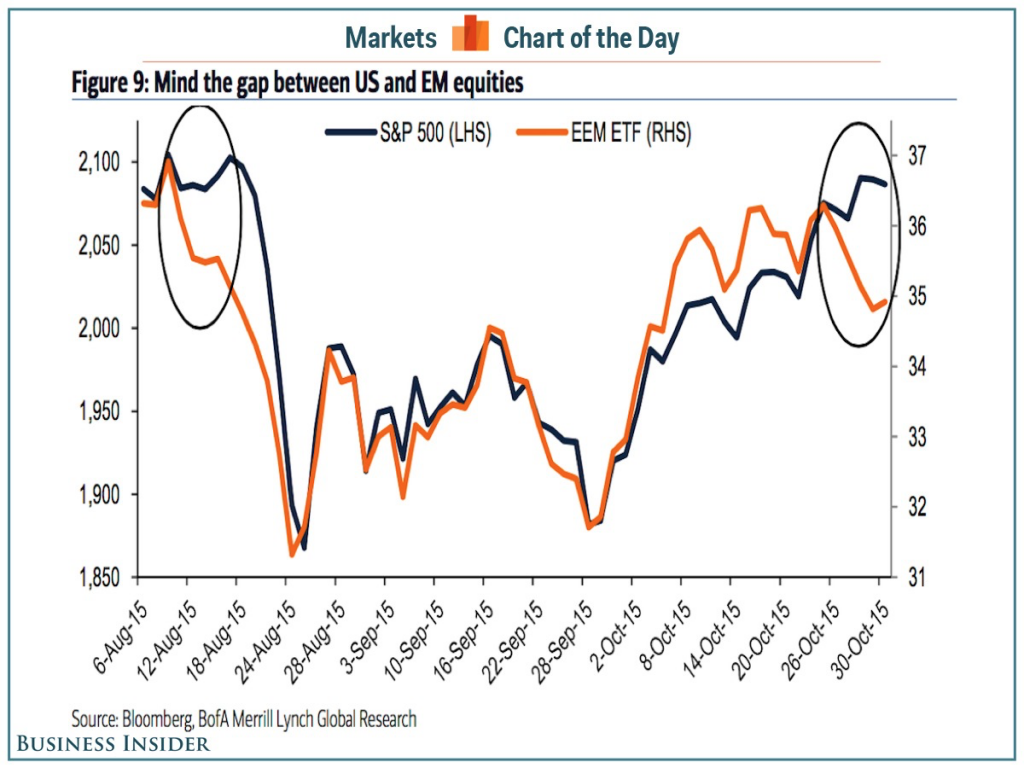
I don’t thing CAPE valuations are the ‘elephant in the room’. First, have a look at the image below:
The disconnect between EM and U.S. equities has been the story of the current calendar year. The image shows that after a brief pullback, the disconnect is re-emerging. I can think of the following reasons:
- The argument for investing in EM’s was high growth. This is no longer valid. Within the EM space what is attractive (India) is expensive. What is cheap (Russia) is dangerous. In such a scenario, moderate US growth is considered positive. Hence, U.S. is the ‘destination of choice’ for money managers who want to invest in equities.
- Due to the EM correction in the current year, most global portfolios have got lopsided. The weight of the Developed Markets is too high. At such times ‘rebalancing’ of portfolios to realign weights does take place. Whatever flows we have seen in the recent past are likely to have been of the ‘rebalancing’ kind.
According to me, the ‘elephant in the room’ is a change in the global investing mindset. Money managers prefer debt over equity. Given the way currencies are fluctuating it is a ‘Hobson’s choice’. Consider the following:
1. Globally, it seems that growth and inflation will continue to be tepid. This is the consensus opinion. Nobody I know has any doubt that this is incorrect. This ‘low growth’ consensus has been a feature of global psyche since the crash of 2008-09. It continues. As a result, expectations of low growth and low inflation are being priced into investing calculations. Hence, the preference for debt. This has had the following consequences:
- All over the investing world, the appetite for ‘safe assets’ is hitting an all time high. Initially, until the year 2011, most of us thought that this preference for safe assets would lead to a ‘Gold Rush’. Mr Market had other ideas. There has been a ‘Debt Rush’ instead!
- Over the last five years, fixed income portfolio flows into EM economies have been to the tune of $1.2 trillion. The comparable figure for the equity market is $500 billion.
- In Europe, bond issuance of less than zero percent bonds is to the tune of $1.9 trillion. In the U.S. too, demand for 10-year Treasuries remains robust.
2. In India, FII’s continue to bid aggressively for Indian government debt. A recent issue of Indian Government bonds was oversubscribed by three times. This is after FII investment limits in government debt were enhanced by the Reserve Bank of India (RBI). The FII’s have even bid for bonds issued by state governments. FII’s seem to be more confident of the Indian Rupee than we Indians are! Click here to read.
3. Effectively, FII’s are not worried about Indian government debt. They are concerned about forward valuations of Indian equities. Simply stated:
- They find Indian equities to be expensive since they see no signs of economic growth. Growth has to start picking up for money to start flowing into equities. There is a kernel of truth in this.
- They are worried about the effect of a Fed rate hike on Indian Corporate Debt. Hence, equities of companies having foreign debt are deemed to be untouchable.
- They are confident that a Fed rate hike will not upset their currency calculations. Effectively, Indian debt is attractive and Indian equities are not.
4. How long this preference of debt over equity will remain is anybody’s guess. Despite the apparent preference for debt, Indian equities have been resilient. We just had a V-shaped recovery. Buying on dips seems to have become fashionable.
5. This post would be incomplete without a word on the outcome of the Bihar elections. Clearly, the outcome is not what the Bulls wanted. The Bihar election outcome is like a ‘big bucket of cold water on the stock market fire’.


