The returns for the calendar year 2017 (thus far) have surprised the most optimistic of market participants. Using Stock Seasonality, I have tried to answer the rhetorical question: Will 2017 be an outlier calendar year for the Indian Stock Market?
Monthly Stock Market Seasonality
For the uninitiated, Seasonality is the characteristic whereby data experiences changes that recur every calendar year. Any predictable pattern in a time series that recurs over a one-year period, can be said to be seasonal. I started by looking at the month-wise returns for the Nifty for all the months from 1995 to 2016. I then compiled the month-wise seasonality. It looks like this:
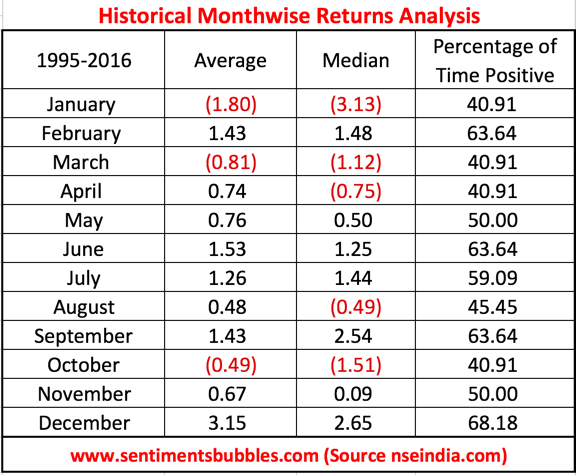
In the image above, I have presented, month-wise, the average and the median returns. Because stock market behaviour is random in nature, I think using Median as a measure makes sense. A couple of observations that I could draw:
- January, April and October seem to be the worst months for the Indian Stock Market.
- Sell in May, works only fifty percent of the time.
- December is clearly the most bullish of all months.
In the first two months of the current calendar year, we have had positive returns of 4.67 and 1.87 percent. Clearly, both January and February 2017, are outliers from a historical perspective. Since 1995 there have been just four calendar years when monthly returns for January and February have both been positive. What are the yearly returns from these years? It is shown below:
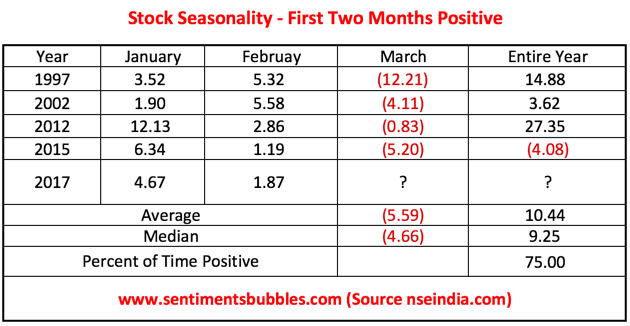
Apparently, on all four occasions when the first two months of the calendar year were positive, March delivered negative returns. The yearly returns are positive seventy-five percent of the time.
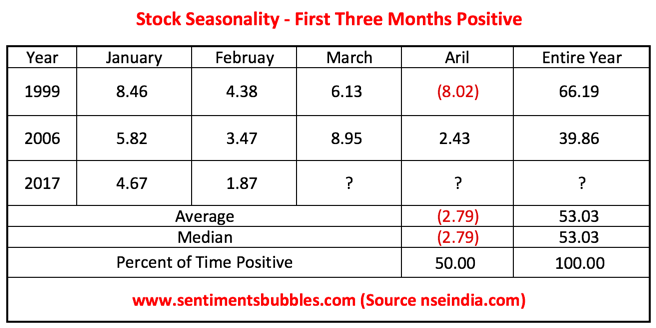
March 2017 has yielded a positive return of 1.81 percent thus far. We have a week of trading left. Assuming that we do end March with a positive return, it would result in a hat-trick of positive returns at the beginning of the calendar year. There have been only two such hat-tricks in the last twenty-two years. On both of these occasions, the Nifty gave robust positive returns for the year. The median returns are above fifty percent as can be seen in the image below:
What about monthly corrections? How sharp have monthly corrections been and what kind of drawdowns do investors have to endure when they decide to invest in stocks? The image below shows the highest and lowest monthly returns from 1995 till date.
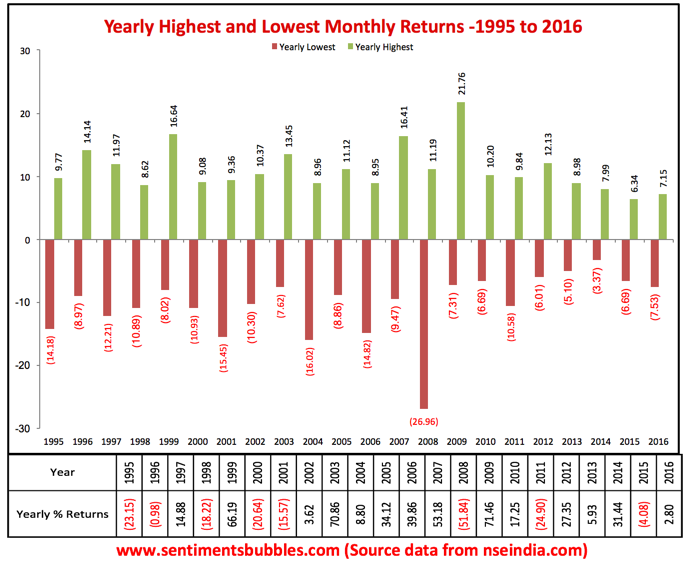
In the image above, the year-end returns for the calendar years are also shown to add perspective. The following is apparent:
- In some years there have been more positive months than negative ones and vice-versa. Regarding the magnitude of the Monthly Volatility, only the highest monthly melt-ups and steepest monthly melt-downs are shown in the image above.
- In every calendar year except 2014, the Nifty has corrected at least five percent in one of the months. For the long-term equity investor, these corrections have been of little significance if he or she did nothing.
- I am stating the obvious when I say that if you buy after a sharp decline, the returns will be higher, everybody knows that. The fact of the matter is that this very simple fact tends to be lost on most of us when we invest.
Why does Seasonality tend to work?
For those of you who think that seasonality is a waste of time, the data presented does support the view that stock market returns do fall in predictable seasonal patterns. How else can you explain performances for months like January and December? Like everything in investing, stock market seasonality is a something that can be argued both ways; you still won’t get the clarity that you seek. The following might help:
- Things don’t always work out the way they have in the past. For seasonal trends to work, there has to be a correlation with causation. The ‘percent of time’ shown in the images in this post, highlights this metric.
- The fact that seasonality is a market anomaly is well-known and now accepted. The answer to the question: ‘Why does it work when it does?’, is a bit nuanced. I think that there is an element of human behaviour in the seasonality metrics. For example, investors tend to book losses in March for taxation purposes. That shows up in the seasonality metrics, with March returns being positive just 40.91 percent of the time.
- Can seasonality be used to generate Alpha? I don’t think so. The relationship between price discovery and human behaviour is too intricate and unpredictable. In my opinion, looking at seasonality may or may not be helpful, the jury is out on that. One thing is for sure; it doesn’t hurt.
- Can one take advantage of seasonality to time the markets? It is widely accepted that market timing can be an entertaining pass time, but not a good way to make money. In spite of this, all of us do end up trying to time the market. In the ultimate analysis, seasonality is just one tool of many. I wouldn’t recommend using it in isolation.
Conclusion
The market has been on a tear. Are valuations stretched? Is the current melt up driven by fundamentals or is it just the demand and supply metric at play? I’m afraid I don’t have the answers to these questions. Plainly, all global stock markets have been moving higher in unison. For investors, there is always something that engenders worry. If the market has been well-behaved, as it has been thus far in 2017, we worry that the end is near. When markets start behaving badly, all of us have feelings of Armageddon; that things will get a lot worse before they get any better. The reality is that things are rarely as good or as bad as we fear or expect.
I am not in the forecasting business. Hence, I am unable to answer the question of whether or not 2017 will be an outlier calendar year. What I have done instead, is to present the data. Readers can draw their conclusions, based on the data presented. My thoughts:
- Does it make sense to wait for a correction? Would that not be tantamount to trying to time the market? I think the answers to both of these questions are in the affirmative.
- Most global markets are trading above their long-term average valuations. Expensive markets don’t stay expensive forever. Investors will have to use their discretion. It is, after all, the better part of valour.